

Psoriasis is consistently associated with an elevated cardiovascular risk. However, biochemical parameters are needed to predict cardiovascular events in these patients. Therefore, we conducted a retrospective cohort study with psoriatic patients undergoing systemic treatment to analyze the value of the triglyceride-glucose (TyG) index in predicting the development of major adverse cardiovascular events (MACE). A total of 150 patients were selected, 12 of whom developed MACE (11 myocardial infarctions and one stroke) after a median follow-up of 17 months. The highest quartile of the TyG index was associated with a greater risk of developing MACE (HR, 9.3; 95%CI, 1.1–78.9). The predictive capabilities of the TyG index for predicting these events showed an area under the curve of 0.75 (0.60–0.90), p=0.001. These results demonstrate that the TyG index could be useful in the early identification of psoriatic patients at high risk of developing MACE.
La psoriasis se asocia consistentemente con un elevado riesgo cardiovascular. Sin embargo, se necesitan parámetros bioquímicos para predecir eventos cardiovasculares en estos pacientes. Por ello, se llevó a cabo un estudio de cohorte retrospectivo de pacientes con psoriasis en tratamiento sistémico, en los que se analizó el valor del índice triglicéridos-glucosa (TyG) para el desarrollo de eventos cardiovasculares adversos mayores (MACE, por major adverse cardiovascular events). Se seleccionaron 150 pacientes en los que, tras una mediana de 17 meses, se presentaron 12 MACE (11 infartos y un ictus). El cuartil de valor más elevado del índice TyG se asoció con un mayor riesgo de desarrollar MACE (HR: 9,3; IC 95%: 1,1-78,9). La capacidad predictiva del índice TyG para predecir los eventos mostró un área bajo la curva de 0,75 (0,60-0,90), p=0,001. Estos resultados evidencian que el índice TyG podría ser útil para identificar tempranamente a los pacientes con psoriasis que tienen un alto riesgo de desarrollar un MACE.

Psoriasis is a chronic inflammatory skin disease associated with a higher incidence of major adverse cardiovascular events (MACE).1–9 However, it is necessary to identify easily obtainable metabolic and hematological parameters to predict the development of MACE in clinical practice.10–16
The triglyceride-glucose (TyG) index is a simple indicator of insulin resistance, associated with the development of cardiovascular events that predicts metabolic disorders (e.g., diabetes mellitus) better than its individual components.17–20
The objective of this study is to analyze whether the TyG index is a predictor of MACE in psoriatic patients who required biological or systemic treatment.
Materials and methodsWe selected patients with psoriasis from the Dermatology Department of Hospital Clínico Universitario de Valencia (Valencia, Spain) with data collected retrospectively from their electronic health records. Psoriatic patients who had received biological or systemic therapy from 2017 through 2022, aged over 18 and under 90, were included. Patients without TyG index information or without repeated annual measurements were excluded.
The primary endpoint of the study was the development of MACE at the follow-up, which included acute myocardial infarction and stroke.
Demographic information and clinical data of the included patients were collected at each visit. Body mass index was calculated as weight in kilograms divided by the square of height in meters. Lab test results, including biochemical values and complete blood count values, were obtained from routine blood tests performed during clinical follow-up. The TyG index was calculated at baseline using the logarithmic product of fasting glucose and serum triglyceride levels divided by 2. The unit of measurement for the TyG index calculation is mg/dL for triglycerides and glucose. The severity of psoriasis in patients was measured using routine clinical scales (PASI, BSA, and DLQI). Systemic or biological therapies received by patients at the time of TyG determination were recorded.
Statistical analysisContinuous variables were expressed as mean and standard deviation or median and interquartile range, and the categorical ones as proportions (%). Study participants were categorized into four groups based on the TyG index quartiles. To obtain p-values for linear trends in baseline characteristics, continuous and categorical variables were used, respectively.
A Cox regression model was used to estimate hazard ratios (HR) and 95% confidence intervals (95%CI) for TyG index quartiles in association with the development of MACE, taking the 1st quartile of the TyG index as the reference group. The multivariable model was constructed using a forward stepwise variable selection approach based on statistical significance (p<0.05). Included variables were those that showed a significant association with cardiovascular event rates in the univariate analysis.
Finally, we performed a sensitivity analysis to evaluate the robustness of the results and fitted a prediction model to our initial data based on the variables. Then, we calculated the area under the curve (AUC) of the characteristics of psoriatic patients (ROC curve) and the 95%CI to compare the predictive power of the TyG index model for MACE.
Analyses were performed using SPSS (BM® SPSS® Statistics). All p-values are two-tailed, and statistical significance was set at the conventional threshold of p<0.05.
ResultsData from 150 psoriatic patients with a mean age (±standard deviation) of 50.76±13.44 and 58.7% men were recorded. The median follow-up was 17 months (8.75–45.90). At the end of follow-up, a total of 12 MACE (11 acute myocardial infarctions and 1 stroke) were found, resulting in an incidence of 8%.
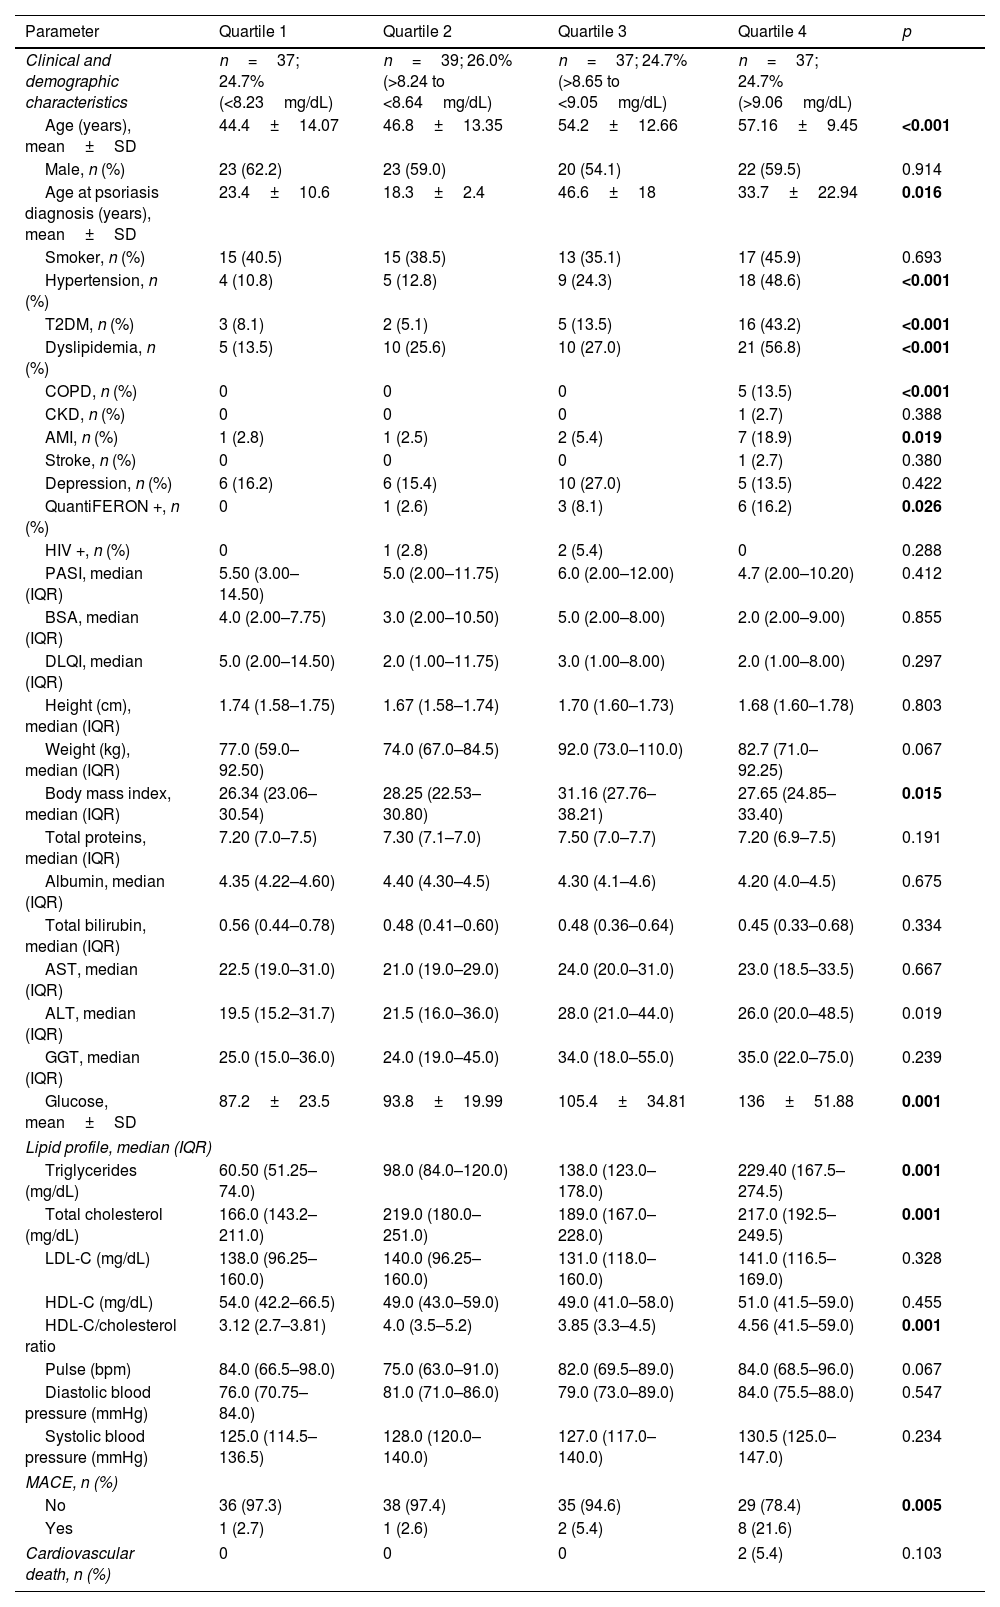
Age, age at psoriasis diagnosis, and body mass index in men were more likely to increase across TyG index quartiles. The incidence of hypertension, type 2 diabetes, mellitus hyperlipidemia, and chronic obstructive pulmonary disease also increased proportionally in the higher TyG index quartiles. Additionally, higher quartiles showed higher frequencies of positive QuantiFERON tests. Glucose, triglyceride, total cholesterol, and HDL-cholesterol index values increased in proportion to TyG index quartiles. Finally, the incidence of MACE increased significantly in the upper quartiles. Regarding treatments, only statins were increasingly used across TyG index quartiles. Data for each TyG index quartile are shown in Table 1 and Table S1 (see supplementary data).
Baseline characteristics of patients by triglyceride-glucose index quartiles.
| Parameter | Quartile 1 | Quartile 2 | Quartile 3 | Quartile 4 | p |
|---|---|---|---|---|---|
| Clinical and demographic characteristics | n=37; 24.7% (<8.23mg/dL) | n=39; 26.0% (>8.24 to <8.64mg/dL) | n=37; 24.7% (>8.65 to <9.05mg/dL) | n=37; 24.7% (>9.06mg/dL) | |
| Age (years), mean±SD | 44.4±14.07 | 46.8±13.35 | 54.2±12.66 | 57.16±9.45 | <0.001 |
| Male, n (%) | 23 (62.2) | 23 (59.0) | 20 (54.1) | 22 (59.5) | 0.914 |
| Age at psoriasis diagnosis (years), mean±SD | 23.4±10.6 | 18.3±2.4 | 46.6±18 | 33.7±22.94 | 0.016 |
| Smoker, n (%) | 15 (40.5) | 15 (38.5) | 13 (35.1) | 17 (45.9) | 0.693 |
| Hypertension, n (%) | 4 (10.8) | 5 (12.8) | 9 (24.3) | 18 (48.6) | <0.001 |
| T2DM, n (%) | 3 (8.1) | 2 (5.1) | 5 (13.5) | 16 (43.2) | <0.001 |
| Dyslipidemia, n (%) | 5 (13.5) | 10 (25.6) | 10 (27.0) | 21 (56.8) | <0.001 |
| COPD, n (%) | 0 | 0 | 0 | 5 (13.5) | <0.001 |
| CKD, n (%) | 0 | 0 | 0 | 1 (2.7) | 0.388 |
| AMI, n (%) | 1 (2.8) | 1 (2.5) | 2 (5.4) | 7 (18.9) | 0.019 |
| Stroke, n (%) | 0 | 0 | 0 | 1 (2.7) | 0.380 |
| Depression, n (%) | 6 (16.2) | 6 (15.4) | 10 (27.0) | 5 (13.5) | 0.422 |
| QuantiFERON +, n (%) | 0 | 1 (2.6) | 3 (8.1) | 6 (16.2) | 0.026 |
| HIV +, n (%) | 0 | 1 (2.8) | 2 (5.4) | 0 | 0.288 |
| PASI, median (IQR) | 5.50 (3.00–14.50) | 5.0 (2.00–11.75) | 6.0 (2.00–12.00) | 4.7 (2.00–10.20) | 0.412 |
| BSA, median (IQR) | 4.0 (2.00–7.75) | 3.0 (2.00–10.50) | 5.0 (2.00–8.00) | 2.0 (2.00–9.00) | 0.855 |
| DLQI, median (IQR) | 5.0 (2.00–14.50) | 2.0 (1.00–11.75) | 3.0 (1.00–8.00) | 2.0 (1.00–8.00) | 0.297 |
| Height (cm), median (IQR) | 1.74 (1.58–1.75) | 1.67 (1.58–1.74) | 1.70 (1.60–1.73) | 1.68 (1.60–1.78) | 0.803 |
| Weight (kg), median (IQR) | 77.0 (59.0–92.50) | 74.0 (67.0–84.5) | 92.0 (73.0–110.0) | 82.7 (71.0–92.25) | 0.067 |
| Body mass index, median (IQR) | 26.34 (23.06–30.54) | 28.25 (22.53–30.80) | 31.16 (27.76–38.21) | 27.65 (24.85–33.40) | 0.015 |
| Total proteins, median (IQR) | 7.20 (7.0–7.5) | 7.30 (7.1–7.0) | 7.50 (7.0–7.7) | 7.20 (6.9–7.5) | 0.191 |
| Albumin, median (IQR) | 4.35 (4.22–4.60) | 4.40 (4.30–4.5) | 4.30 (4.1–4.6) | 4.20 (4.0–4.5) | 0.675 |
| Total bilirubin, median (IQR) | 0.56 (0.44–0.78) | 0.48 (0.41–0.60) | 0.48 (0.36–0.64) | 0.45 (0.33–0.68) | 0.334 |
| AST, median (IQR) | 22.5 (19.0–31.0) | 21.0 (19.0–29.0) | 24.0 (20.0–31.0) | 23.0 (18.5–33.5) | 0.667 |
| ALT, median (IQR) | 19.5 (15.2–31.7) | 21.5 (16.0–36.0) | 28.0 (21.0–44.0) | 26.0 (20.0–48.5) | 0.019 |
| GGT, median (IQR) | 25.0 (15.0–36.0) | 24.0 (19.0–45.0) | 34.0 (18.0–55.0) | 35.0 (22.0–75.0) | 0.239 |
| Glucose, mean±SD | 87.2±23.5 | 93.8±19.99 | 105.4±34.81 | 136±51.88 | 0.001 |
| Lipid profile, median (IQR) | |||||
| Triglycerides (mg/dL) | 60.50 (51.25–74.0) | 98.0 (84.0–120.0) | 138.0 (123.0–178.0) | 229.40 (167.5–274.5) | 0.001 |
| Total cholesterol (mg/dL) | 166.0 (143.2–211.0) | 219.0 (180.0–251.0) | 189.0 (167.0–228.0) | 217.0 (192.5–249.5) | 0.001 |
| LDL-C (mg/dL) | 138.0 (96.25–160.0) | 140.0 (96.25–160.0) | 131.0 (118.0–160.0) | 141.0 (116.5–169.0) | 0.328 |
| HDL-C (mg/dL) | 54.0 (42.2–66.5) | 49.0 (43.0–59.0) | 49.0 (41.0–58.0) | 51.0 (41.5–59.0) | 0.455 |
| HDL-C/cholesterol ratio | 3.12 (2.7–3.81) | 4.0 (3.5–5.2) | 3.85 (3.3–4.5) | 4.56 (41.5–59.0) | 0.001 |
| Pulse (bpm) | 84.0 (66.5–98.0) | 75.0 (63.0–91.0) | 82.0 (69.5–89.0) | 84.0 (68.5–96.0) | 0.067 |
| Diastolic blood pressure (mmHg) | 76.0 (70.75–84.0) | 81.0 (71.0–86.0) | 79.0 (73.0–89.0) | 84.0 (75.5–88.0) | 0.547 |
| Systolic blood pressure (mmHg) | 125.0 (114.5–136.5) | 128.0 (120.0–140.0) | 127.0 (117.0–140.0) | 130.5 (125.0–147.0) | 0.234 |
| MACE, n (%) | |||||
| No | 36 (97.3) | 38 (97.4) | 35 (94.6) | 29 (78.4) | 0.005 |
| Yes | 1 (2.7) | 1 (2.6) | 2 (5.4) | 8 (21.6) | |
| Cardiovascular death, n (%) | 0 | 0 | 0 | 2 (5.4) | 0.103 |
AMI: acute myocardial infarction; ALT: alanine aminotransferase; AST: aspartate aminotransferase; BSA: body surface area; CKD: chronic kidney disease; COPD: chronic obstructive pulmonary disease; GGT: gamma-glutamyl transferase; HDL-C: high-density lipoprotein cholesterol; LDL-C: low-density lipoprotein cholesterol; DLQI: dermatology life quality index; HIV: human immunodeficiency virus; IQR: interquartile range; MACE: major adverse cardiovascular events; PASI: psoriasis area and severity index; SD: standard deviation; T2DM: type 2 diabetes mellitus.
Bolded values indicate statistically significant p-values (<0.05).
In the crude Cox regression model, the HR for the highest TyG index quartile was 9.33 (95%CI, 1.1–78.9) (Table S2 of the supplementary data). In none of the models adjusted for statin use, age, age at diagnosis, hypertension, diabetes, dyslipidemia, chronic obstructive pulmonary disease, acute myocardial infarction, and glucose were statistically significant differences in HRs across TyG index quartiles found, taking the 1st quartile as the reference group (Tables S3 and S4 of the supplementary data). However, the HR progressively increased across the higher TyG index quartiles. In the Pearson correlation analysis, no significant correlation was observed between the TyG index and psoriasis severity measured with the PASI index (r=0.085, p>0.05). In the ROC curve analysis, we found an AUC of 0.75 (95%CI, 0.60–0.90, p=0.001) (Fig. 1).
Discussion
Psoriasis is a prevalent skin disease associated with an elevated cardiovascular risk.1–4 However, to date, there are no simple biochemical parameters that allow clinicians to establish a cardiovascular risk level in their patients, which would enable them to adapt prevention strategies and adjust treatments.6,7
Recently, Xie et al.19 have published a positive correlation between the TyG index and carotid atherosclerosis in patients with psoriatic arthritis, regardless of traditional cardiovascular risk factors and psoriasis-related factors.
In our study, we found consistent results in terms of patient characteristics and MACE incidence with other published TyG index series to date.10,11 However, no studies have been published specifically analyzing the relationship between the TyG index and the development of MACE in psoriatic patients.
Of note, the incidence of MACE increases statistically significantly (p=0.015) across TyG index quartiles, indicating that this parameter is very likely related to the development of cardiovascular events in psoriatic patients.
Additionally, although we did not find statistical significance in any of the adjusted Cox regression models, all showed an upward trend in HRs across the higher TyG index quartiles. This lack of statistical significance is likely due to the small sample size in our analysis, which is an important limitation of our study and leaves the door open for future studies to confirm this association.
Recently, O’Hagan et al.18 demonstrated that the TyG index correlates with well-established markers of insulin resistance and subclinical atherosclerosis in their cohort of 284 psoriatic patients, concluding that larger studies are needed to evaluate the clinical utility and better understand the relationship of the TyG index with other known risk factors, demonstrating the clinical potential of the TyG index in assessing cardiometabolic risk in psoriasis.
Sánchez-Íñigo et al.17 studied the ability of the TyG index to predict cardiovascular events in a cohort of 5014 healthy patients and concluded that the TyG index – which is a simple and widely used measure – could be useful for early identification of individuals at high risk of developing a cardiovascular event. In their prediction models, they found AUCs of ROC curves of 0.71 (0.68–0.73) for the Framingham model and 0.72 (0.70–0.74) for the Framingham+TyG index model (p=0.014). In our psoriatic population, the result of a significant AUC value of 0.75 (0.61–0.89, p=0.001) is striking and consistent with their results. Therefore, we propose that although the TyG index is a good predictor of MACE in our psoriatic population, it is probably not superior to its value in the general population. Thus, more studies are needed to evaluate its clinical utility in psoriatic patients.
ConclusionsThe TyG index is a simple and widely available metabolic parameter useful for predicting cardiovascular events in psoriatic patients. This study highlights the clinical potential of the TyG index for early identification of psoriatic patients at high risk of developing a cardiovascular event.
CRediT authorship contribution statementLeopoldo Fernández Domper was responsible for data collection, manuscript drafting, and literature search and analysis.
María Morales Suarez-Varela was responsible for data analysis, reviewed the manuscript, and approved the final version.
José María Martin Hernández, Jose Antonio Páramo, Leopoldo Fernández Alonso, and Ángeles Revert Fernández reviewed the manuscript and approved the final version.
Ethical statementThis study was approved by Hospital Clínico Universitario de Valencia Ethics Committee.
FundingThis research was supported by Hospital Clínico Universitario de Valencia Dermatology Department.
Conflicts of interestNone declared.
This study received support from Hospital Clínico Universitario de Valencia Dermatology Department and is an integral part of Dr. Leopoldo Fernández Domper's doctoral research project.
The following are the supplementary data to this article:


