While the introduction of biologics has improved the quality of life of patients with psoriasis and psoriatic arthritis, it may have increased the economic burden of these diseases.
ObjectiveTo perform a systematic review of studies on the costs associated with managing and treating psoriasis and psoriatic arthritis in 5 European countries: Germany, Spain, France, Italy, and the United Kingdom.
MethodsWe undertook a systematic review of the literature (up to May 2015) using the MEDLINE and EMBASE databases. The methodological quality of the studies identified was evaluated using the Consolidated Health Economic Evaluation Reporting Standards checklist. We considered both direct costs (medical and nonmedical) and indirect costs, adjusted for country-specific inflation and converted to international dollars using purchasing power parity exchange rates for 2015 ($US PPP).
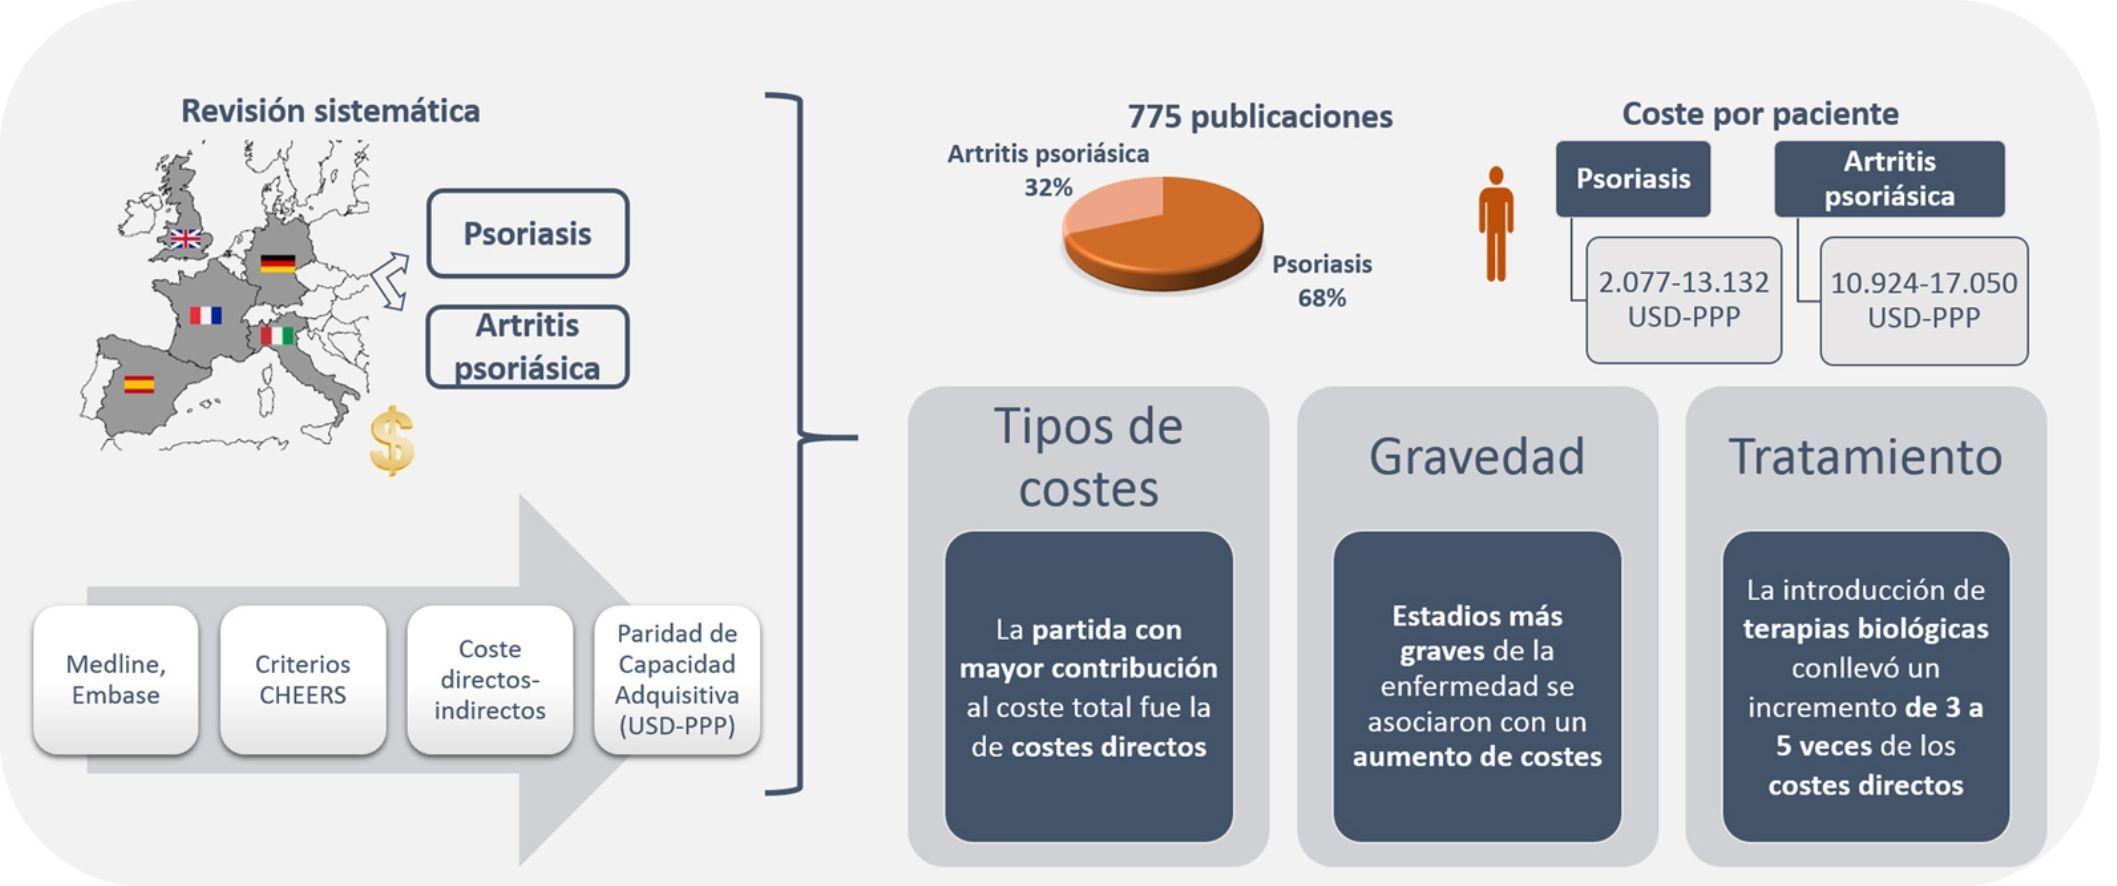
ResultsThe search retrieved 775 studies; 68.3% analyzed psoriasis and 31.7% analyzed psoriatic arthritis. The total annual cost per patient ranged from US $2,077 to US $13,132 PPP for psoriasis and from US $10,924 to US $17,050 PPP for psoriatic arthritis. Direct costs were the largest component of total expenditure in both diseases. The severity of these diseases was associated with higher costs. The introduction of biologics led to a 3-fold to 5-fold increase in direct costs, and consequently to an increase in total costs.
ConclusionsWe have analyzed the economic burden of psoriasis and psoriatic arthritis and shown that costs increase with the treatment and management of more severe disease and the use of biologics.
La introducción de las terapias biológicas ha mejorado la calidad de vida de los pacientes con psoriasis y artritis psoriásica, aunque podría haber incrementado su carga económica.
Objetivo: Revisar los estudios de costes del manejo de la psoriasis y artritis psoriásica en cinco países de Europa (Alemania, España, Francia, Italia y Reino Unido).
MétodosRevisión sistemática de la literatura en Medline y Embase hasta mayo 2015. La calidad metodológica de las publicaciones se evaluó mediante las recomendaciones de la Consolidated Health Economics Reporting Standard (CHEERS). Se consideraron costes directos (sanitarios y no sanitarios) e indirectos, actualizados por la inflación de cada país y ajustados a dólares internacionales 2015 mediante la Paridad de Capacidad Adquisitiva (USD-PPP).
ResultadosSe identificaron 775 publicaciones, 68,3% de psoriasis y 31,7% de artritis psoriásica. El coste total anual por paciente osciló entre 2.077-13.132 USD-PPP y 10.924-17.050 USD-PPP en psoriasis y artritis psoriásica, respectivamente. En ambas patologías, la partida con mayor contribución al coste total fue la relacionada con costes directos. Estadios más graves de la enfermedad se asociaron con un aumento de costes. La introducción de terapias biológicas conllevó un incremento de 3 a 5 veces de los costes directos, que repercutió en los costes totales.
ConclusionesEsta revisión pone de manifiesto el impacto económico que supone el tratamiento y manejo de la psoriasis y artritis psoriásica, el cual aumenta en función de la gravedad del paciente y de la inclusión de terapias biológicas.
Clinical skin and joint manifestations of the chronic autoimmune diseases psoriasis (psoriasis) and psoriatic arthritis (psoriatic arthritis) not only have a major impact on health-related quality of life of the patients,1 but also represent a substantial economic burden on health systems.2,3 Psoriasis generally follows a chronic course, with relapses associated with different skin manifestations.4 Psoriatic arthritis is a chronic disease affecting the musculoskeletal system. It is usually seronegative and may be associated with psoriasis.5 Patients with psoriatic arthritis usually but not always present with skin manifestations before joint involvement is apparent,6 and in approximately 80% of patients, the presence of psoriasis occurs before the onset of psoriatic arthritis7 with a lag usually in excess of 10 years from diagnosis of psoriasis.6 In addition, although there is no clear correlation, there appears to be a greater risk of psoriatic arthritis in patients with more severe forms of psoriasis.7
The prevalence of these diseases is not well defined, given the heterogeneity of the clinical manifestations and differences in the diagnostic and classification criteria.9–11 Estimates of the prevalence of psoriasis and psoriatic arthritis range from 1.3% to 2.2% and from 0.3% to 1% of the population, respectively.6,8 In Spain, although the number of studies is limited, according to estimates from recent data, the prevalence of psoriasis lies between 1.2% and 2.3%,12,13 and the prevalence of psoriatic arthritis is estimated to be 0.17%.12 Furthermore, the prevalence of psoriatic arthritis in patients with psoriasis in Europe is significant, ranging from 9.8% in the Spanish population12 to 13.8% in the United Kingdom.14
The therapeutic approach to psoriasis and psoriatic arthritis is broad-ranging, and includes a first stage with conventional therapy (topical agents, phototherapy, glucocorticosteroids, nonsteroidal antiinflammatory agents, and nonbiologic disease modifying antirheumatic drugs) and a second stage with biologic therapies in patients refractory to conventional therapy.8,15,16
Although a dose-dependent relationship between the use of biologic agents and the risk of infection has recently been observed,3 such agents are extremely effective and have considerably improved health-related quality of life.8 The counterpoint to this improvement is that the introduction of new biologic agents may increase the economic burden associated with these diseases.2,8 Thus, the objective of this study was to review the studies of costs of psoriasis and psoriatic arthritis management in the 5 biggest economies in Europe (Germany, Spain, France, Italy, and the United Kingdom).
MethodsStudy IdentificationA systematic review of the literature was undertaken using the MEDLINE and EMBASE (via OVID) databases, with a cutoff of May 2015. The search strategy was based on use of search terms related to the type of patients and intervention (Medical Subject Headings, free text), syntactic operators, and techniques used (simple and combined searches). The search was not limited by year of publication, type of study, or language, and included both full articles and conference abstracts. The Supplementary Material describes the strategy used for the 2 diseases.
Study SelectionEligible studies were those published in English or Spanish in national or international journals that analyzed the cost of the disease. Studies had to include information on the estimation of direct health costs (for example, pharmacological and nonpharmacological treatment, visits to the physician, diagnostic tests, admission to hospital, rehabilitation, patient costs), nonmedical costs (transport, rehabilitation, out-of-pocket expenses), and/or indirect costs (lost productivity, sick leave, early retirement, unemployment, professional reorientation). There were no restrictions on the time horizon for the studies.
Publications that were not strictly studies of cost of the disease (for example, cost-effectiveness, cost-utility, cost-benefit analyses, and budget impact) were excluded. Likewise, studies conducted in European countries other than the 5 aforementioned ones were excluded.
Duplicate and rejected publications were represented along with those finally included with a flow diagram according to the criteria of the PRISMA statement.17
Data ExtractionData extraction from the published studies occurred in 2 phases. In the first, one of the authors (RB) extracted the data and a second author (IE) reviewed these data. The discrepancies found were then resolved by discussion and consensus among the authors. A standard data collection sheet was used with different parameters (authors/year of publication, disease, country, study population, perspective used, cost estimation, results) for data collection.
The results of the costs were recorded in the original currency of each country (euros and pounds sterling) (original costs). Those studies with results in a currency other than euros (pounds sterling in the United Kingdom) were transformed to euros using the reference exchange rate as published by the Central European Bank for the year in which the costs of the article were estimated.18 The costs of the year of assessment in each study were adjusted to 2015 using the rate of inflation in the corresponding country, according to the data for the harmonized index of consumer prices provided by the OECD.STAT (updated costs).19 Then, to adjust for the different purchasing power of the different currencies and to eliminate differences between countries, a purchasing power parity [PPP] factor was applied, converting costs to international dollars updated to 2015 (US$ PPP).20
Assessment of QualityThe quality of the studies included was assessed according to the list of recommendations of the Consolidated Health Economics Reporting Standard (CHEERS).21 Of the 27 recommendations included in the 24 items that make up the list, 11 were not applicable to the type of study selected for the review (studies of disease costs).
ResultsWe retrieved 775 publications, 529 (68.3%) about psoriasis and 246 (31.7%) about psoriatic arthritis. During the selection process, 761 publications were excluded because they were duplicates or did not meet the inclusion criteria (Fig. 1). Finally, 14 publications were included, 10 related to the cost of psoriasis (n=5,537 patients) and 4 to psoriatic arthritis (n=3,828 patients).
Germany is the country with most publications of studies of disease costs, both in psoriasis and psoriatic arthritis (n=5), followed by Italy and Spain (n=3), United Kingdom (n=2), and France (n=1).
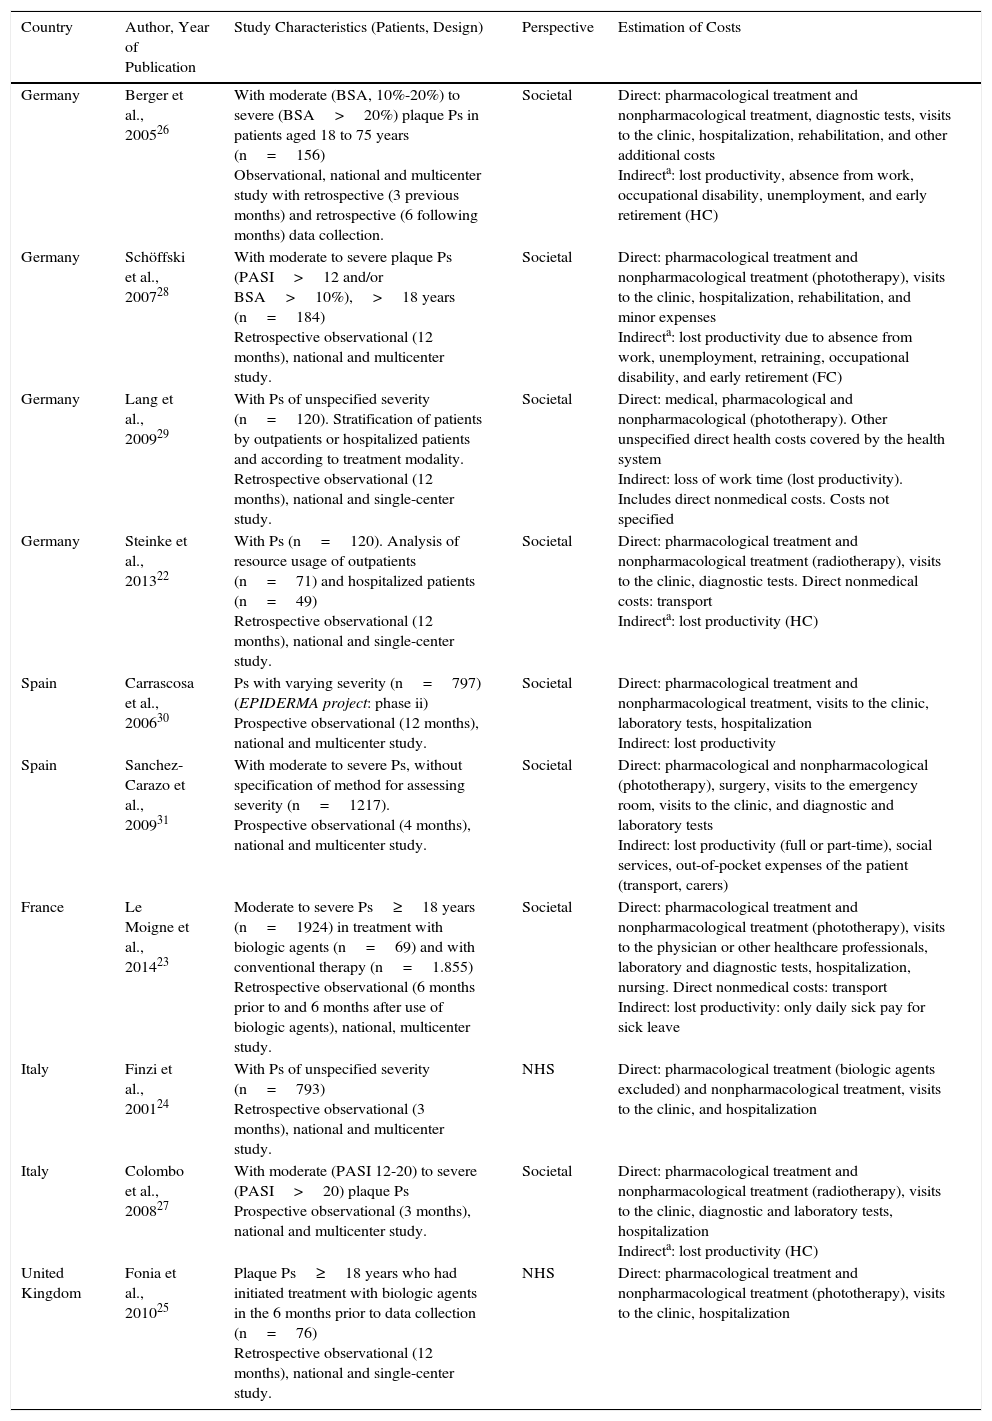
All the studies of psoriasis reported direct health costs (pharmacological and nonpharmacological) and 2 also reported direct nonmedical costs.22,23 A societal perspective was used in all studies except for 2, which used the health system perspective.24,25 The human capital method was used to assess indirect costs in 3 publications,22,26,27 whereas one used the friction costs method.28 The remaining publications that used the societal perspective did not specify the method used for calculating indirect costs. The time horizon ranged from 324,27 to 12 months.22,23,25,27,29,30 In 6 of the 10 publications, patients with moderate to severe psoriasis were selected,23,25–28,31 and only 3 used tools such as the psoriasis area severity index and/or body surface area.26–28 Of the remaining 4 publications, 2 stratified the patients according to whether they had been hospitalized or not,22,29 and 2 assessed the costs associated with management before and after administration of biologic therapy (Table 1).23,25
Characteristics of the Studies Analyzing the Cost of Psoriasis.
| Country | Author, Year of Publication | Study Characteristics (Patients, Design) | Perspective | Estimation of Costs |
|---|---|---|---|---|
| Germany | Berger et al., 200526 | With moderate (BSA, 10%-20%) to severe (BSA>20%) plaque Ps in patients aged 18 to 75 years (n=156) Observational, national and multicenter study with retrospective (3 previous months) and retrospective (6 following months) data collection. | Societal | Direct: pharmacological treatment and nonpharmacological treatment, diagnostic tests, visits to the clinic, hospitalization, rehabilitation, and other additional costs Indirecta: lost productivity, absence from work, occupational disability, unemployment, and early retirement (HC) |
| Germany | Schöffski et al., 200728 | With moderate to severe plaque Ps (PASI>12 and/or BSA>10%),>18 years (n=184) Retrospective observational (12 months), national and multicenter study. | Societal | Direct: pharmacological treatment and nonpharmacological treatment (phototherapy), visits to the clinic, hospitalization, rehabilitation, and minor expenses Indirecta: lost productivity due to absence from work, unemployment, retraining, occupational disability, and early retirement (FC) |
| Germany | Lang et al., 200929 | With Ps of unspecified severity (n=120). Stratification of patients by outpatients or hospitalized patients and according to treatment modality. Retrospective observational (12 months), national and single-center study. | Societal | Direct: medical, pharmacological and nonpharmacological (phototherapy). Other unspecified direct health costs covered by the health system Indirect: loss of work time (lost productivity). Includes direct nonmedical costs. Costs not specified |
| Germany | Steinke et al., 201322 | With Ps (n=120). Analysis of resource usage of outpatients (n=71) and hospitalized patients (n=49) Retrospective observational (12 months), national and single-center study. | Societal | Direct: pharmacological treatment and nonpharmacological treatment (radiotherapy), visits to the clinic, diagnostic tests. Direct nonmedical costs: transport Indirecta: lost productivity (HC) |
| Spain | Carrascosa et al., 200630 | Ps with varying severity (n=797) (EPIDERMA project: phase ii) Prospective observational (12 months), national and multicenter study. | Societal | Direct: pharmacological treatment and nonpharmacological treatment, visits to the clinic, laboratory tests, hospitalization Indirect: lost productivity |
| Spain | Sanchez-Carazo et al., 200931 | With moderate to severe Ps, without specification of method for assessing severity (n=1217). Prospective observational (4 months), national and multicenter study. | Societal | Direct: pharmacological and nonpharmacological (phototherapy), surgery, visits to the emergency room, visits to the clinic, and diagnostic and laboratory tests Indirect: lost productivity (full or part-time), social services, out-of-pocket expenses of the patient (transport, carers) |
| France | Le Moigne et al., 201423 | Moderate to severe Ps≥18 years (n=1924) in treatment with biologic agents (n=69) and with conventional therapy (n=1.855) Retrospective observational (6 months prior to and 6 months after use of biologic agents), national, multicenter study. | Societal | Direct: pharmacological treatment and nonpharmacological treatment (phototherapy), visits to the physician or other healthcare professionals, laboratory and diagnostic tests, hospitalization, nursing. Direct nonmedical costs: transport Indirect: lost productivity: only daily sick pay for sick leave |
| Italy | Finzi et al., 200124 | With Ps of unspecified severity (n=793) Retrospective observational (3 months), national and multicenter study. | NHS | Direct: pharmacological treatment (biologic agents excluded) and nonpharmacological treatment, visits to the clinic, and hospitalization |
| Italy | Colombo et al., 200827 | With moderate (PASI 12-20) to severe (PASI>20) plaque Ps Prospective observational (3 months), national and multicenter study. | Societal | Direct: pharmacological treatment and nonpharmacological treatment (radiotherapy), visits to the clinic, diagnostic and laboratory tests, hospitalization Indirecta: lost productivity (HC) |
| United Kingdom | Fonia et al., 201025 | Plaque Ps≥18 years who had initiated treatment with biologic agents in the 6 months prior to data collection (n=76) Retrospective observational (12 months), national and single-center study. | NHS | Direct: pharmacological treatment and nonpharmacological treatment (phototherapy), visits to the clinic, hospitalization |
Abbreviations: BSA, body surface area; FC, friction costs; HC, human capital; PASI, psoriasis area severity index; Ps, psoriasis; NHS, national health system (National Health Service in the United Kingdom).
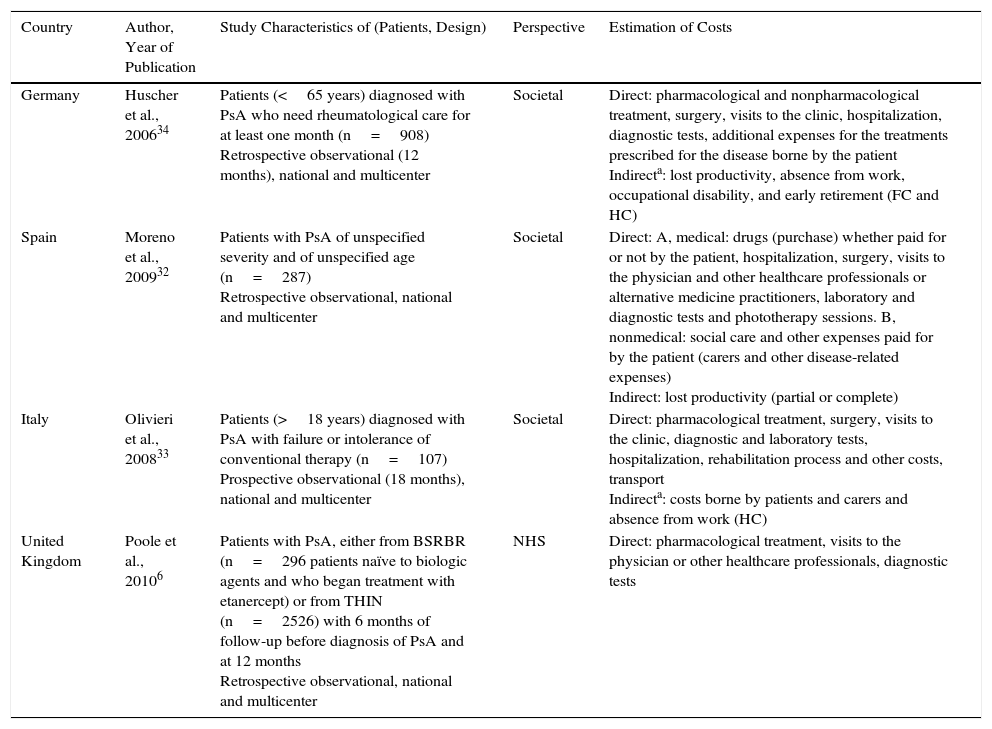
The 4 publications selected for psoriatic arthritis analyzed the pharmacological and nonpharmacological costs among the direct health costs, and 2 also included direct nonmedical costs.32,33 Three of the publications reported data from the societal perspective,32–34 with the human capital method alone used in one of these,33 and both methods (human capital and friction costs) in the other.34 One publication did not specify the method for calculating the indirect costs used,32 and another used the health system perspective.7 The time horizon ranged from 1234 to 18 months.7,33 In one study, the time horizon was not specified, although annualized costs were presented.32 All analyses calculated the total cost of psoriatic arthritis after 1 year, except for one study that assessed resource usage 6 months before and after exposure to a biologic agent.33 One of the studies assessed the cost of the disease in patients with psoriatic arthritis who had not received previous treatment with a biologic agent (Table 2).7
Characteristics of the Studies Analyzing the Cost of Psoriatic Arthritis.
| Country | Author, Year of Publication | Study Characteristics of (Patients, Design) | Perspective | Estimation of Costs |
|---|---|---|---|---|
| Germany | Huscher et al., 200634 | Patients (<65 years) diagnosed with PsA who need rheumatological care for at least one month (n=908) Retrospective observational (12 months), national and multicenter | Societal | Direct: pharmacological and nonpharmacological treatment, surgery, visits to the clinic, hospitalization, diagnostic tests, additional expenses for the treatments prescribed for the disease borne by the patient Indirecta: lost productivity, absence from work, occupational disability, and early retirement (FC and HC) |
| Spain | Moreno et al., 200932 | Patients with PsA of unspecified severity and of unspecified age (n=287) Retrospective observational, national and multicenter | Societal | Direct: A, medical: drugs (purchase) whether paid for or not by the patient, hospitalization, surgery, visits to the physician and other healthcare professionals or alternative medicine practitioners, laboratory and diagnostic tests and phototherapy sessions. B, nonmedical: social care and other expenses paid for by the patient (carers and other disease-related expenses) Indirect: lost productivity (partial or complete) |
| Italy | Olivieri et al., 200833 | Patients (>18 years) diagnosed with PsA with failure or intolerance of conventional therapy (n=107) Prospective observational (18 months), national and multicenter | Societal | Direct: pharmacological treatment, surgery, visits to the clinic, diagnostic and laboratory tests, hospitalization, rehabilitation process and other costs, transport Indirecta: costs borne by patients and carers and absence from work (HC) |
| United Kingdom | Poole et al., 20106 | Patients with PsA, either from BSRBR (n=296 patients naïve to biologic agents and who began treatment with etanercept) or from THIN (n=2526) with 6 months of follow-up before diagnosis of PsA and at 12 months Retrospective observational, national and multicenter | NHS | Direct: pharmacological treatment, visits to the physician or other healthcare professionals, diagnostic tests |
Abbreviations: BSRBR: British Society of Rheumatology Biologics Register; FC, friction costs; HC, human capital; NHS, National Health Service; PsA, psoriatic arthritis; THIN: The Health Improvement Network.
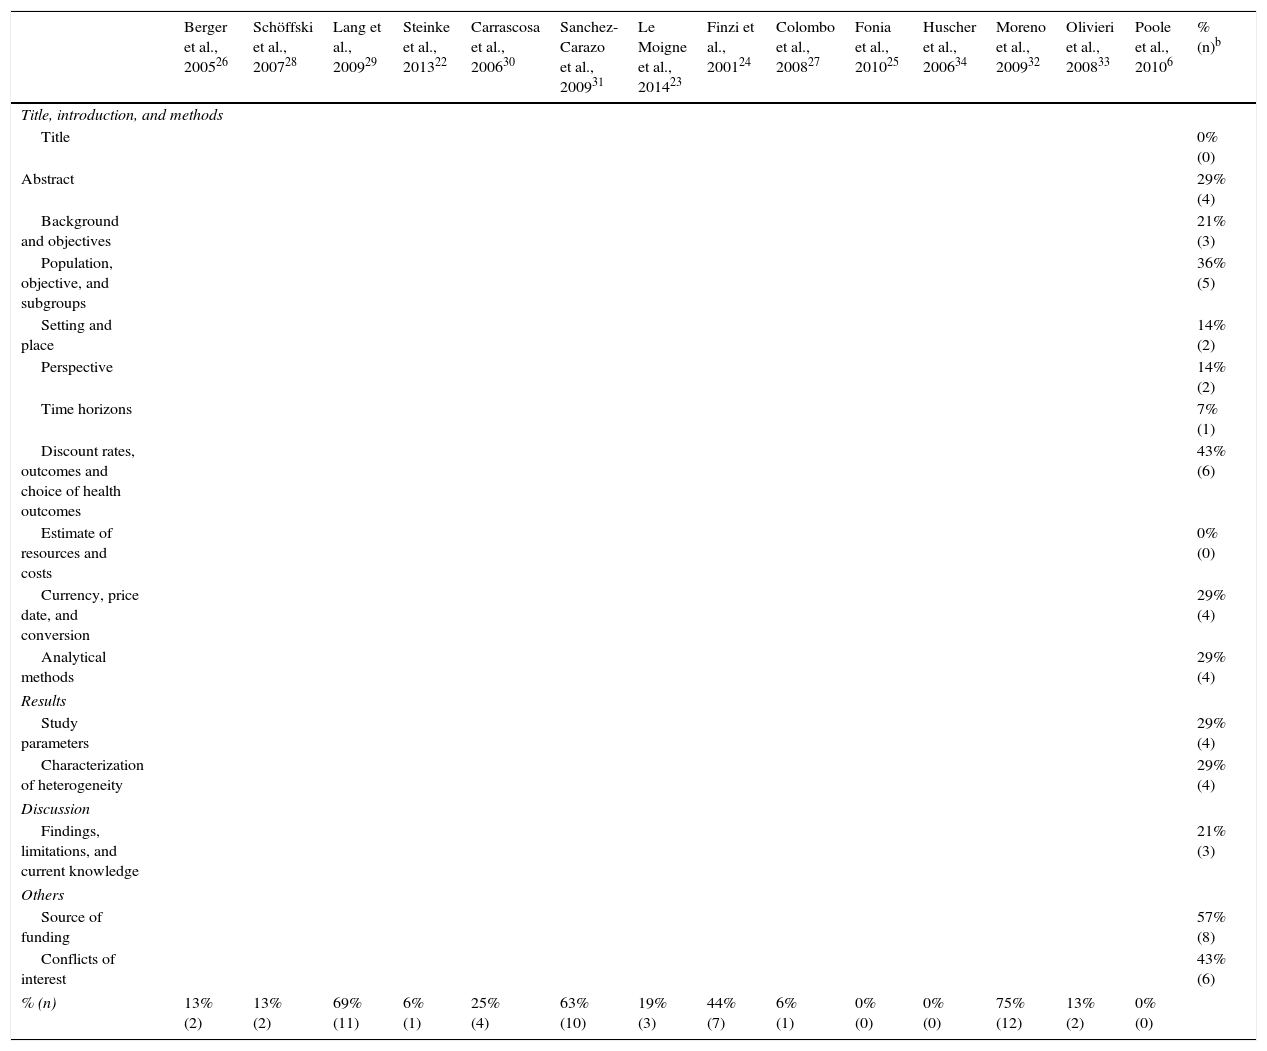
After assessing the reporting quality of 14 selected studies using the CHEERS statement, 8 of them (7 in psoriasis and 1 in psoriatic arthritis) did not explicitly specify the source of funding and 6 (5 in psoriasis an 1 in psoriatic arthritis) did not provide any information on conflicts of interest, population included, and methodology to obtain the preferences for each outcome measure. In 5 of the studies (3 in psoriasis and 2 in psoriatic arthritis), the selected subgroup populations were not detailed (Table 3).
Results of the Evaluation According to the CHEERS List of Recommendationsa
| Berger et al., 200526 | Schöffski et al., 200728 | Lang et al., 200929 | Steinke et al., 201322 | Carrascosa et al., 200630 | Sanchez-Carazo et al., 200931 | Le Moigne et al., 201423 | Finzi et al., 200124 | Colombo et al., 200827 | Fonia et al., 201025 | Huscher et al., 200634 | Moreno et al., 200932 | Olivieri et al., 200833 | Poole et al., 20106 | % (n)b | |
|---|---|---|---|---|---|---|---|---|---|---|---|---|---|---|---|
| Title, introduction, and methods | |||||||||||||||
| Title | 0% (0) | ||||||||||||||
| Abstract | 29% (4) | ||||||||||||||
| Background and objectives | 21% (3) | ||||||||||||||
| Population, objective, and subgroups | 36% (5) | ||||||||||||||
| Setting and place | 14% (2) | ||||||||||||||
| Perspective | 14% (2) | ||||||||||||||
| Time horizons | 7% (1) | ||||||||||||||
| Discount rates, outcomes and choice of health outcomes | 43% (6) | ||||||||||||||
| Estimate of resources and costs | 0% (0) | ||||||||||||||
| Currency, price date, and conversion | 29% (4) | ||||||||||||||
| Analytical methods | 29% (4) | ||||||||||||||
| Results | |||||||||||||||
| Study parameters | 29% (4) | ||||||||||||||
| Characterization of heterogeneity | 29% (4) | ||||||||||||||
| Discussion | |||||||||||||||
| Findings, limitations, and current knowledge | 21% (3) | ||||||||||||||
| Others | |||||||||||||||
| Source of funding | 57% (8) | ||||||||||||||
| Conflicts of interest | 43% (6) | ||||||||||||||
| % (n) | 13% (2) | 13% (2) | 69% (11) | 6% (1) | 25% (4) | 63% (10) | 19% (3) | 44% (7) | 6% (1) | 0% (0) | 0% (0) | 75% (12) | 13% (2) | 0% (0) | |
Results expressed as percentage noncompliant. Item in grey indicates criterion not met. Item in green indicates criterion is met
Source: Husereau et al.21
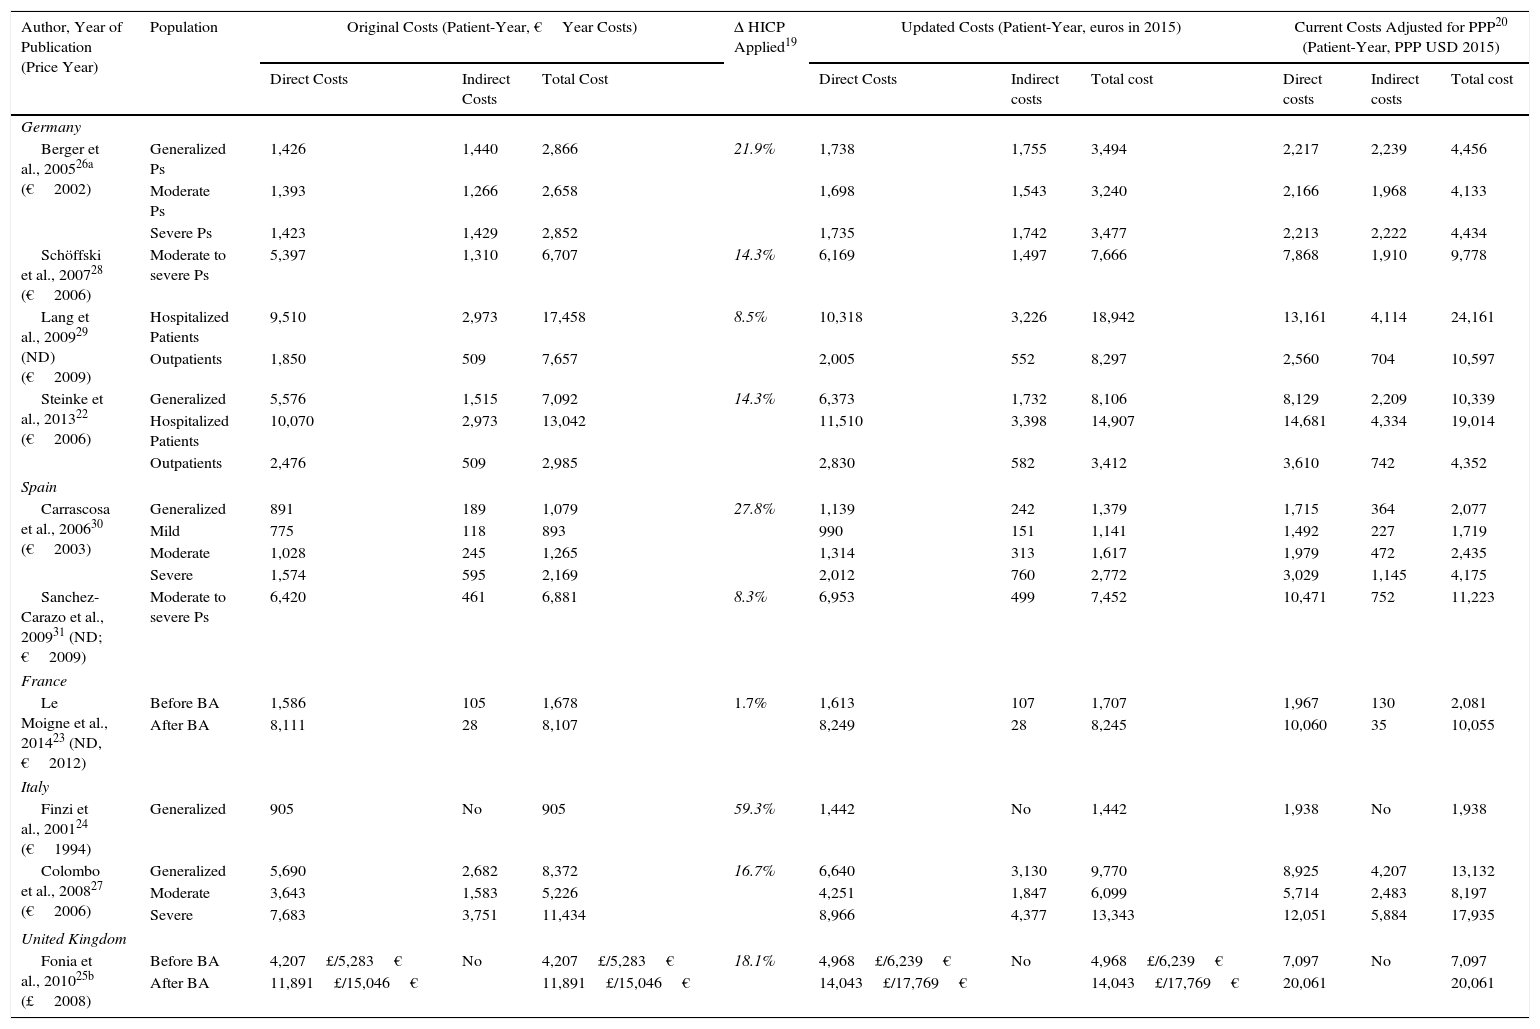
The annual cost of psoriasis, regardless of severity, lay between US $2,077 and $13,132PPP patient-year,30,31 excluding studies of biologic agents,23,25 and a study that assessed only hospitalized patients.29 The direct and indirect costs ranged from US $1,715 to $8,925 and from US $364 to $4,207 PPP patient-year, respectively (Table 4). The direct costs were those that accounted for the greatest proportion of the total cost (between 50% and 93%), with the maximum proportion reported in a Spanish study (Fig. 2A).31
Cost of Psoriasis.
| Author, Year of Publication (Price Year) | Population | Original Costs (Patient-Year, €Year Costs) | Δ HICP Applied19 | Updated Costs (Patient-Year, euros in 2015) | Current Costs Adjusted for PPP20 (Patient-Year, PPP USD 2015) | ||||||
|---|---|---|---|---|---|---|---|---|---|---|---|
| Direct Costs | Indirect Costs | Total Cost | Direct Costs | Indirect costs | Total cost | Direct costs | Indirect costs | Total cost | |||
| Germany | |||||||||||
| Berger et al., 200526a (€2002) | Generalized Ps | 1,426 | 1,440 | 2,866 | 21.9% | 1,738 | 1,755 | 3,494 | 2,217 | 2,239 | 4,456 |
| Moderate Ps | 1,393 | 1,266 | 2,658 | 1,698 | 1,543 | 3,240 | 2,166 | 1,968 | 4,133 | ||
| Severe Ps | 1,423 | 1,429 | 2,852 | 1,735 | 1,742 | 3,477 | 2,213 | 2,222 | 4,434 | ||
| Schöffski et al., 200728 (€2006) | Moderate to severe Ps | 5,397 | 1,310 | 6,707 | 14.3% | 6,169 | 1,497 | 7,666 | 7,868 | 1,910 | 9,778 |
| Lang et al., 200929 (ND)(€2009) | Hospitalized Patients | 9,510 | 2,973 | 17,458 | 8.5% | 10,318 | 3,226 | 18,942 | 13,161 | 4,114 | 24,161 |
| Outpatients | 1,850 | 509 | 7,657 | 2,005 | 552 | 8,297 | 2,560 | 704 | 10,597 | ||
| Steinke et al., 201322 (€2006) | Generalized | 5,576 | 1,515 | 7,092 | 14.3% | 6,373 | 1,732 | 8,106 | 8,129 | 2,209 | 10,339 |
| Hospitalized Patients | 10,070 | 2,973 | 13,042 | 11,510 | 3,398 | 14,907 | 14,681 | 4,334 | 19,014 | ||
| Outpatients | 2,476 | 509 | 2,985 | 2,830 | 582 | 3,412 | 3,610 | 742 | 4,352 | ||
| Spain | |||||||||||
| Carrascosa et al., 200630 (€2003) | Generalized | 891 | 189 | 1,079 | 27.8% | 1,139 | 242 | 1,379 | 1,715 | 364 | 2,077 |
| Mild | 775 | 118 | 893 | 990 | 151 | 1,141 | 1,492 | 227 | 1,719 | ||
| Moderate | 1,028 | 245 | 1,265 | 1,314 | 313 | 1,617 | 1,979 | 472 | 2,435 | ||
| Severe | 1,574 | 595 | 2,169 | 2,012 | 760 | 2,772 | 3,029 | 1,145 | 4,175 | ||
| Sanchez-Carazo et al., 200931 (ND; €2009) | Moderate to severe Ps | 6,420 | 461 | 6,881 | 8.3% | 6,953 | 499 | 7,452 | 10,471 | 752 | 11,223 |
| France | |||||||||||
| Le Moigne et al., 201423 (ND, €2012) | Before BA | 1,586 | 105 | 1,678 | 1.7% | 1,613 | 107 | 1,707 | 1,967 | 130 | 2,081 |
| After BA | 8,111 | 28 | 8,107 | 8,249 | 28 | 8,245 | 10,060 | 35 | 10,055 | ||
| Italy | |||||||||||
| Finzi et al., 200124 (€1994) | Generalized | 905 | No | 905 | 59.3% | 1,442 | No | 1,442 | 1,938 | No | 1,938 |
| Colombo et al., 200827 (€2006) | Generalized | 5,690 | 2,682 | 8,372 | 16.7% | 6,640 | 3,130 | 9,770 | 8,925 | 4,207 | 13,132 |
| Moderate | 3,643 | 1,583 | 5,226 | 4,251 | 1,847 | 6,099 | 5,714 | 2,483 | 8,197 | ||
| Severe | 7,683 | 3,751 | 11,434 | 8,966 | 4,377 | 13,343 | 12,051 | 5,884 | 17,935 | ||
| United Kingdom | |||||||||||
| Fonia et al., 201025b (£2008) | Before BA | 4,207£/5,283€ | No | 4,207£/5,283€ | 18.1% | 4,968£/6,239€ | No | 4,968£/6,239€ | 7,097 | No | 7,097 |
| After BA | 11,891£/15,046€ | 11,891£/15,046€ | 14,043£/17,769€ | 14,043£/17,769€ | 20,061 | 20,061 | |||||
Abbreviations: BA, biologic agents; HICP, harmonized index of consumer prices; ND, no data; PPP, purchasing power parity; Ps, psoriasis.
Percentage of direct and indirect costs by total cost per patient-year (according to current costs, US$ PPP 2015). A, Psoriasis. B, Psoriatic arthritis.
Two studies of psoriasis conducted in France23 and the United Kindgom25 and 1 study of psoriatic arthritis conducted in Italy33 were excluded because they only assessed exposure to biologic agents.
An increase in costs was seen in those studies that analyzed patients with severe disease (direct, indirect, and total cost between US $2,213 and $12,051, $1,145 and $5,884, and $4,175 and $17,935PPP patient-year, respectively). When the costs were assessed by grouping patients with moderate to severe psoriasis, the direct and total costs were similar (US $7,868-$10,471 and $9,778-$11,223 PPP patient-year, respectively), with the highest costs corresponding to the study conducted in Spain.31
The total cost of hospitalized patients was analyzed in 2 German studies, with the direct and total costs exceding those of the other studies included in this review (US $13,161-$14,681 and $19,014-$24,161PPP patient-year, respectively).22,29
In addition, the direct costs for management of psoriasis increased by 3-fold to 5-fold after administration of a biologic agent (before the biologic agent: US $1,967 to $10,060 PPP patient-year; after the biologic agent: US $7,097 to $20,061 PPP patient-year), due to an increase in pharmacological costs (before the biologic agent: US $412 to $8,013 PPP patient-year; after the biologic agent: US $2,111 to $18,064 PPP patient-year) with a similar impact on total costs (Fig. 3A).23,25
Impact of introduction of biologic agents (BA). A, Percentage of costs before and after exposure to BA in psoriasis. B, Percentage of costs before and after exposure to BA in psoriatic arthritis. C, Variation (in percent) of costs before and after exposure to BA in psoriatic arthritis.
aPercentage of costs associated with patients with plaque psoriasis. The patients received treatment with systemic nonbiologic agents and topical agents before and after treatment with biologic agents.
bPatients with moderate to severe psoriasis. The pharmacological cost of patients treated with BA also includes other systemic drugs.
cPatients with psoriatic arthritis with failure or intolerance of conventional therapy. The percentage of costs after starting BA-based treatment was calculated from the increment in cost and cost before starting with BA.
dExpresses the incremental cost in patients treated with BA compared to an earlier period.
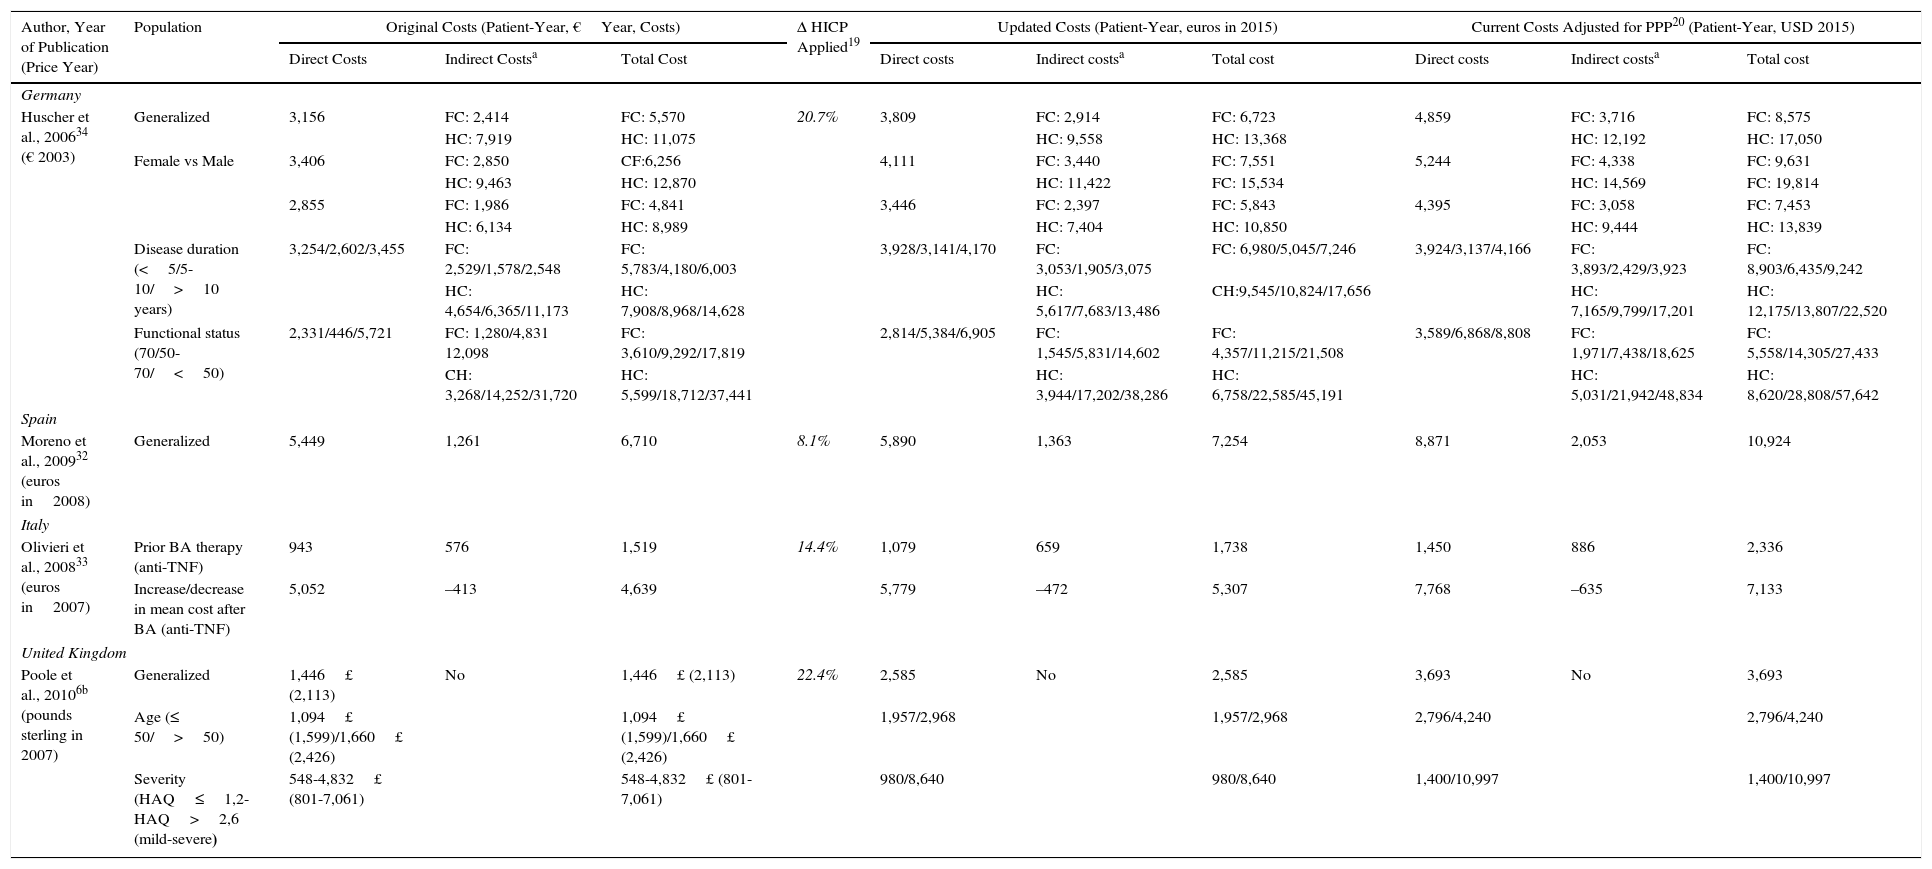
The annual cost per patient of psoriatic arthritis lay between US $10,924 and $17,050PPP patient-year,32,34 and exceeded US $57,000 PPP patient-year when considering only patients with severe disease.34 The direct costs varied between US $3,693 and $8,871PPP patient-year, and the indirect costs between US $2,053 and $3,716 (friction costs method) and US $12,192 (human capital method) PPP patient-year (Table 5). Among the studies that used the societal perspective, the item that accounted for the biggest share of the total cost varied from study to study, with higher direct costs reported in the study conducted in Spain,32 whereas the study conducted in Germany had higher indirect costs (Fig. 2B).34
Cost of Psoriatic Arthritis.
| Author, Year of Publication (Price Year) | Population | Original Costs (Patient-Year, €Year, Costs) | Δ HICP Applied19 | Updated Costs (Patient-Year, euros in 2015) | Current Costs Adjusted for PPP20 (Patient-Year, USD 2015) | ||||||
|---|---|---|---|---|---|---|---|---|---|---|---|
| Direct Costs | Indirect Costsa | Total Cost | Direct costs | Indirect costsa | Total cost | Direct costs | Indirect costsa | Total cost | |||
| Germany | |||||||||||
| Huscher et al., 200634 (€ 2003) | Generalized | 3,156 | FC: 2,414 | FC: 5,570 | 20.7% | 3,809 | FC: 2,914 | FC: 6,723 | 4,859 | FC: 3,716 | FC: 8,575 |
| HC: 7,919 | HC: 11,075 | HC: 9,558 | HC: 13,368 | HC: 12,192 | HC: 17,050 | ||||||
| Female vs Male | 3,406 | FC: 2,850 | CF:6,256 | 4,111 | FC: 3,440 | FC: 7,551 | 5,244 | FC: 4,338 | FC: 9,631 | ||
| HC: 9,463 | HC: 12,870 | HC: 11,422 | FC: 15,534 | HC: 14,569 | FC: 19,814 | ||||||
| 2,855 | FC: 1,986 | FC: 4,841 | 3,446 | FC: 2,397 | FC: 5,843 | 4,395 | FC: 3,058 | FC: 7,453 | |||
| HC: 6,134 | HC: 8,989 | HC: 7,404 | HC: 10,850 | HC: 9,444 | HC: 13,839 | ||||||
| Disease duration (<5/5-10/>10 years) | 3,254/2,602/3,455 | FC: 2,529/1,578/2,548 | FC: 5,783/4,180/6,003 | 3,928/3,141/4,170 | FC: 3,053/1,905/3,075 | FC: 6,980/5,045/7,246 | 3,924/3,137/4,166 | FC: 3,893/2,429/3,923 | FC: 8,903/6,435/9,242 | ||
| HC: 4,654/6,365/11,173 | HC: 7,908/8,968/14,628 | HC: 5,617/7,683/13,486 | CH:9,545/10,824/17,656 | HC: 7,165/9,799/17,201 | HC: 12,175/13,807/22,520 | ||||||
| Functional status (70/50-70/<50) | 2,331/446/5,721 | FC: 1,280/4,831 12,098 | FC: 3,610/9,292/17,819 | 2,814/5,384/6,905 | FC: 1,545/5,831/14,602 | FC: 4,357/11,215/21,508 | 3,589/6,868/8,808 | FC: 1,971/7,438/18,625 | FC: 5,558/14,305/27,433 | ||
| CH: 3,268/14,252/31,720 | HC: 5,599/18,712/37,441 | HC: 3,944/17,202/38,286 | HC: 6,758/22,585/45,191 | HC: 5,031/21,942/48,834 | HC: 8,620/28,808/57,642 | ||||||
| Spain | |||||||||||
| Moreno et al., 200932 (euros in2008) | Generalized | 5,449 | 1,261 | 6,710 | 8.1% | 5,890 | 1,363 | 7,254 | 8,871 | 2,053 | 10,924 |
| Italy | |||||||||||
| Olivieri et al., 200833 (euros in2007) | Prior BA therapy (anti-TNF) | 943 | 576 | 1,519 | 14.4% | 1,079 | 659 | 1,738 | 1,450 | 886 | 2,336 |
| Increase/decrease in mean cost after BA (anti-TNF) | 5,052 | –413 | 4,639 | 5,779 | –472 | 5,307 | 7,768 | –635 | 7,133 | ||
| United Kingdom | |||||||||||
| Poole et al., 20106b (pounds sterling in 2007) | Generalized | 1,446£ (2,113) | No | 1,446£ (2,113) | 22.4% | 2,585 | No | 2,585 | 3,693 | No | 3,693 |
| Age (≤ 50/>50) | 1,094£ (1,599)/1,660£ (2,426) | 1,094£ (1,599)/1,660£ (2,426) | 1,957/2,968 | 1,957/2,968 | 2,796/4,240 | 2,796/4,240 | |||||
| Severity (HAQ≤1,2-HAQ>2,6 (mild-severe) | 548-4,832£ (801-7,061) | 548-4,832£ (801-7,061) | 980/8,640 | 980/8,640 | 1,400/10,997 | 1,400/10,997 | |||||
Abbreviations: Anti-TNF, anti-tumor necrosis factor alfa agents; BA, biologic agents; HC, human capital; HICP, harmonized index of consumer prices; FC, friction costs; ND, no data; PPP, purchasing power parity; PsA, psoriatic arthritis
An increase in costs was seen in those studies that analyzed patients with severe disease (direct, indirect, and total cost of US $8,808, $48,834, and $57,642 PPP patient-year, respectively).34 Likewise, on analyzing the cost in patients with psoriatic arthritis who were treated for 6 months with or without a biologic agent, a greater than 5-fold increase was observed in direct costs (US $7,768PPP patient-year), essentially because of the increased pharmacological cost (US $7,101PPP patient-year), as well as a reduction of US $635PPP in indirect costs in patients treated with biologic agents (Figs. 3B and C).33
DiscussionThe results of this study suggest that, in Europe, psoriasis and psoriatic arthritis are associated with a substantial economic impact. The annual cost of managing a patient with psoriasis is variable and in line with previously published reviews,2,35 except for the annual cost in Sweden, which was greater (11,928€ —in euros 2009—equivalent to US $14,820PPP).2
Except for 2 German studies,26,34 the direct costs account for the greatest part of the total cost from the societal perspective, both in psoriasis (6 studies) and psoriatic arthritis (2 studies). Spain was the country with the lowest annual direct costs per patient in psoriasis and the highest costs in psoriatic arthritis.
According to the present study, a directly proportional relationship between the severity of disease and the associated cost can be established, driven mainly by an increase in direct costs. In one of the reviews mentioned above,35 an increase (of up to 2.5-fold) in the cost of management of severe psoriasis compared with moderate psoriasis was detected, driven mainly by the greater resource consumption and associated loss of productivity.
Although the introduction of biologic agents seems to have led to a reduction in hospital costs for the management of psoriasis, with a decrease of 2,357€ vs 564€ patient-year (euros 2013, equivalent to US $2,902 to $695PPP patient-year),35 the increase in direct and total cost identified in the studies of psoriasis and psoriatic arthritis23,25,33 showed the huge economic impact of their incorporation into the therapeutic arsenal. The effect of introducing biologic agents in Europe has been evaluated previously.36–38 The usage of the different biologic agents available for treatment of moderate to severe psoriasis in Spain was associated with a total cost between 12,120 and 18,370€ patient-year (euros 2010, equivalent to US $19,385 and $29,381PPP patient-year).36 In the Netherlands, the inclusion of biologic agents increased the cost of management of psoriasis to 17,712€ from 10,146€ (euros 2010, equivalent to US $23,791 and $13,628PPP patient-year, respectively).37
In Italy, the cost of treating patients with psoriatic arthritis refractory to nonbiologic systemic disease modifying antirheumatic drugs and those treated with anti-TNF agents for 5 years was assessed, showing a significant increase in direct costs due to pharmacological expenditure on anti-TNF agents. This increase was slightly offset by a decrease in indirect costs.38
One of the possible limitations of this review is the variability in the methodology used in the studies (study population, sample size, follow-up duration, perspective used, year of costs assessed) and this might hinder comparison of results and thus extrapolation of conclusions.
Assessment of the methodological quality of the studies included with the CHEERS criteria21 identified considerable differences among studies. Some publications were presented in the form of congress absracts,29,31,32 without any corresponding full-text article in a scientific journal. This limits the amount of information available and may explain the high rate of noncompliance found in the CHEERS assessment. Another critical item missing in some publications was the date of costs.23,24,29,31 This shortcoming was addressed using the year of data collection,23,24 or the date of publication.29,31 Thus, the presentation of costs with different dates and currencies could be a serious limitation for comparability of the results. However, adjustment for increased harmonized index of consumer prices19 and the subsequent conversion to the currency of current international Dollars (US$ PPP2015)20 has eliminated differences in the prices between countries and, therefore, balances the purchasing power of different currencies, making the comparison more feasible.39
Another difference to consider is the use of different methods for the calculation of indirect costs. On the one hand, the friction costs method assesses the loss due to absence from work by estimating the cost required to replace the worker.40 By contrast, the human capital method measures future monetary productivity of individuals who benefit from a health activity, for example, pensions that do not need to be paid to prevent occupational diseases or the work days that are not lost.41 The use of one or other method may have an impact on total cost, as observed in a publication on psoriatic arthritis that showed a substantial increase in indirect costs when the human capital method was used to calculate indirect costs.34
Another possible limitation of the present study is the small number of publications identified, as although the PRISMA criteria were applied17 and the PubMed and EMBASE databases were used, other sources of grey literature were not assessed (see Annex 1).
Furthermore, it may be supposed that clinical management of psoriasis and psoriatic arthritis has changed considerably in recent decades, mainly as a result of the introduction of biologic agents in everyday clinical practice. Given that the most recent study reviewed here collected data in 2011,23 the current costs of the diseases may actually be higher.
The low number of analyses focused on estimating the cost of psoriasis or psoriatic arthritis points to the need for and importance of future studies of the cost of the disease. These studies should reflect clinical practice and provide useful and up-to-date information for decision making in health care, in light particularly of the arrival of biosimilar biologic agents for the management of these 2 diseases.
In conclusion, despite the limitations mentioned above, a review of the studies included shows the high economic impact of treatment and management of psoriasis and psoriatic arthritis. Costs increase with increasing severity and in particular with the use of biologic agents.
Ethical ResponsibilitiesProtection of human and animal subjectsThe authors declare that no experiments were performed on humans or animals for this investigation.
Confidentiality of dataThe authors declare that patient data do not appear in this article.
Right to privacy and informed consentThe authors declare that patient data do not appear in this article.
FundingCelgene S.L. provided unconditional funding for conducting this project.
Conflicts of InterestMTC is an employee of Celgene. RBP, IE, and MAC are employees of Pharmacoeconomics & Outcomes Research Iberia (PORIB), which received unconditional financial support for writing the present manuscript. JMMS has received fees from PORIB for collaboration and consultation in this project. JMVC declares no conflict of interest and has received no fees for participation in or contribution to the present study.
The authors would like to thank Itziar Oyagüez and Nuria Ortega for their comments during the review of the manuscript.
Please cite this article as: Burgos-Pol R, Martínez-Sesmero JM, Ventura-Cerdá JM, Elías I, Caloto MT, Casado MÁ. Coste de la psoriasis y artritis psoriásica en cinco países de Europa: una revisión sistemática. Actas Dermosifiliogr. 2016;107:577–590.
