To determine resource usage and costs associated with atopic dermatitis in adults according to severity and comorbid conditions in daily clinical practice.
Patients and methodsWe performed an observational, retrospective study based on a review of registries of patients aged ≥18 years who sought health care in 2013 and 2014 in an area of Catalonia, Spain, with a population of 215,634 persons. We established 3 classes of severity depending on the treatment prescribed. The variables evaluated were total comorbid conditions, concomitant/specific medication, and direct/indirect health care costs. The statistical analysis was based on multiple regression models. Statistical significance was set at P<.05.
ResultsWe included 6,186 patients with a diagnosis of atopic dermatitis (mean age, 47.1 years; women, 61.6%). We established 3 groups based on severity, as follows: mild (n=3,445 [55.7%]); moderate (n=2,361 [38.2%]); and severe (n=380 [6.1%]). Severe atopic dermatitis was associated with risk of presenting comorbid conditions (β=0.192), namely, asthma (β=0.138), depression (β=0.099), cardiovascular events (β=0.087), obesity (β=0.085), and smoking (β=0.025); P<.001. Costs reached €9.3 million (health care costs, 75.5%; loss of productivity, 24.5%), with an average unit cost of €1,504 per year. The corrected average unit cost (ANCOVA) was greater in severe atopic dermatitis compared with moderate and mild disease (€3,397 vs €2,111 vs €885; P<.001), respectively.
ConclusionsSevere atopic dermatitis generates considerable usage of health care resources and high costs for the National Health System. These are in proportion with the severity of the disease. General comorbid conditions and asthma were the factors with the greatest impact on health care costs.
Determinar el uso de los recursos y los costes de la dermatitis atópica (DA) en adultos según su gravedad y las comorbilidades asociadas en situación de práctica clínica habitual.
Pacientes y métodosSe efectuó un diseño observacional retrospectivo realizado a partir de la revisión de registros de pacientes ≥18años que demandaron asistencia durante 2013-2014 en un área geográfica de Cataluña con una población de 215.634 personas. Se constituyeron 3 grupos de gravedad en función del tratamiento prescrito. Las variables evaluadas fueron el conjunto de comorbilidades, la medicación concomitante/específica; y los costes sanitarios directos/indirectos. El análisis estadístico se elaboró mediante modelos de regresión múltiple, p<0,05.
ResultadosSe reclutaron 6.186 sujetos con diagnóstico de DA (edad-media: 47,1años; mujeres, 61,6%). En función de la gravedad de la DA se consideraron 3 grupos; el 55,7% leve (n=3.445), el 38,2% moderada (n=2.361) y el 6,1% grave (n=380). La DA grave se asoció a la probabilidad de presentar comorbilidades (β=0,192); específicamente: asma (β=0,138), depresión (β=0,099), eventos cardiovasculares (β=0,087), obesidad (β=0,085) y hábito tabáquico (β=0,025), p<0,001. El coste ascendió a 9,3 millones de euros (costes sanitarios: 75,5%; pérdidas de productividad: 24,5%), con un promedio/unitario de 1.504euros/año. Los promedios/unitarios corregidos (ANCOVA) fueron mayores en la DA grave en comparación con la moderada y la leve (3.397 vs 2.111 y 885 euros, respectivamente; p<0,001).
ConclusionesLa DA grave se asocia a una elevada utilización de recursos sanitarios y costes para el Sistema Nacional de Salud proporcional a la gravedad de la dermatosis. La comorbilidad general y el asma fueron los factores con mayor impacto asociado al coste sanitario.
Atopic dermatitis (AD) is a recurrent chronic inflammatory disease of the skin.1 Its morphology varies with the patient's age, although recurrent forms are predominant, and the most common symptom is pruritus.2 The etiology of AD is complex, involving genetic factors and a combination of allergic factors (80% of patients present increased levels of immunoglobulin E) and nonallergic factors (epidermal barrier dysfunction, biological factors, and environmental factors).1–4AD affects around 10%-15% of children and 2%-7% of adults, especially in developed countries.2,5,6 Fifty percent of cases resolve during adolescence, and the disease can persist in up to 20% of adults.1 The incidence is higher in women, although more males are affected during childhood. Moderate to severe forms account for around 10%-20% of all cases of AD.1,2
AD generates a considerable psychosocial burden for patients and their families.7 Prognosis is poorer in patients with the following characteristics: a family history of AD, late onset, disseminated atopic dermatitis during childhood, female sex, and association with other allergic diseases (asthma and rhinitis).1–4 At present, topical corticosteroids are considered the cornerstone of pharmacologic treatment in moderate cases, whereas severe cases are treated with phototherapy and systemic immunomodulators such as ciclosporinA, methotrexate, mycophenolate mofetil, or azathioprine.2,4 However, ongoing clinical phase III clinical trials in patients with moderate to severe disease are assessing biologics targeting specific aspects of the pathogenic process.8,9
AD generates a high cost burden for patients and their families.10 However, since most studies only evaluate the cost of drug therapy, there is a paucity of evidence, including data on resource usage and costs associated with AD in Spain.11,12 Moreover, there is a growing need for naturalistic studies on the real clinical conditions of health care interventions that appropriately reflect the flow of patients through the health system, consumption of health care and social resources, and the impact on comorbidities. The objective of the present study was to determine the usage of resources and costs generated by AD in adults according to severity (mild, moderate, and severe) under conditions of daily clinical practice.
Patients and MethodsStudy Population and DesignWe performed an observational, multicenter, and longitudinal (retrospective) study based on a review of medical registries (computerized databases with anonymized data). The study population comprised patients from the computerized records of health care providers from various primary care centers in Catalonia, Spain and from several hospitals, specifically in the area of Badalona, which has a population of 215 634 inhabitants. These data were pooled in the anonymous database of the Fundación RedISS (Red de Investigación en Servicios Sanitarios [Network for Research in Health Care Services]). The data were obtained from the computerized clinical history (OMIAP) and from additional databases. All of the centers were registered providers of CatSalut (Servicio Catalán de la Salud [Catalonian Health Service]), which is publicly funded and uses private service providers.
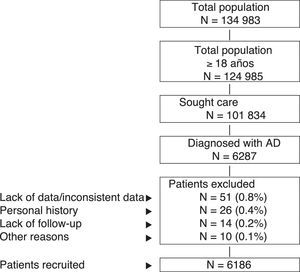
Inclusion and Exclusion CriteriaThe study population comprised patients who sought health care during 2013-2014 (inclusion period, index date) and who fulfilled the following characteristics: (a) age ≥18years; (b) diagnosis of AD (registry) at least 12 weeks before the index date; (c) participation in the prescription program (with verifiable registration of the dose, time interval, and duration of each treatment administered; ≥2 prescriptions during follow-up); and (d) guaranteed regular follow-up (≥2 health-related entries in the computer system). We excluded the following: (a) patients transferred to other centers, patients moved, or patients from outside the area; (b) permanently institutionalized patients; and (c) patients with a history of seborrheic dermatitis, contact dermatitis, and/or mycotic eczema. Figure 1 shows the flow diagram of the study patients based on the inclusion and exclusion criteria.
Diagnosis of Atopic Dermatitis, Classification of Severity, and Follow-upThe registers of patients with AD were obtained based on codes S87, S88, and S99 of the International Classification of Primary Care13 and/or on specific codes of the International Classification of Diseases, Ninth Edition, Clinical Modification, which include the following: AD, allergic dermatitis, allergic eczema, atopic eczema, and dry skin (xerosis). AD was diagnosed by the physician (primary care physician and/or reference dermatologist) according to the criteria of Hanifin and Rajka14 (>1-year history of AD). Classification of AD by severity was based on the treatment algorithm of Garnacho et al.15Table 1 shows the classification of severity according to the treatments prescribed. Follow-up lasted 1 year (running from the date the patient was included).
Classification of Severity According to the Treatment Prescribed.
| Mild | Moderate | Severe |
|---|---|---|
| Emollients | Calcineurin inhibitors (topical immunomodulators) | Immunosuppressants |
| Low-/medium-potency topical corticosteroids (hydrocortisone, clobetasone, dexamethasone, betamethasone, fluocinolone, and triamcinolone) | High-potency topical corticosteroids | Biologics |
| Monotherapy with UV radiation | Hospitalization for atopic dermatitis | |
| Oral corticosteroids |
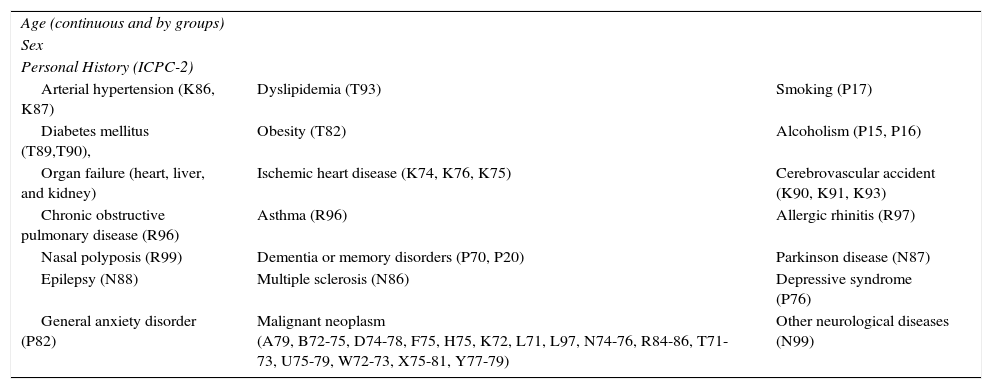
The sociodemographic and comorbidity variables collected are shown in Table 2. For each patient seen, the summary variable of general comorbidity used comprised the following: (a) the number of diagnoses of chronic conditions; (b) the Charlson comorbidity index16 as an approximate measure of severity; and (c) the individual case-mix index obtained from the Adjusted Clinical Groups (ACG) system, which classifies patients according to iso-consumption of resources.17 ACG provides the resource utilization bands (RUBs), by which patients are grouped according to their general morbidity into 1 of 5 mutually exclusive categories (1, healthy users or users with very low morbidity; 2, low morbidity; 3, moderate morbidity; 4, high morbidity; and 5, very high morbidity).
Sociodemographic and Comorbidity Variables.
| Age (continuous and by groups) | ||
| Sex | ||
| Personal History (ICPC-2) | ||
| Arterial hypertension (K86, K87) | Dyslipidemia (T93) | Smoking (P17) |
| Diabetes mellitus (T89,T90), | Obesity (T82) | Alcoholism (P15, P16) |
| Organ failure (heart, liver, and kidney) | Ischemic heart disease (K74, K76, K75) | Cerebrovascular accident (K90, K91, K93) |
| Chronic obstructive pulmonary disease (R96) | Asthma (R96) | Allergic rhinitis (R97) |
| Nasal polyposis (R99) | Dementia or memory disorders (P70, P20) | Parkinson disease (N87) |
| Epilepsy (N88) | Multiple sclerosis (N86) | Depressive syndrome (P76) |
| General anxiety disorder (P82) | Malignant neoplasm (A79, B72-75, D74-78, F75, H75, K72, L71, L97, N74-76, R84-86, T71-73, U75-79, W72-73, X75-81, Y77-79) | Other neurological diseases (N99) |
Abbreviation: ICPC-2: International Classification of Primary Care, Second Edition.13
All medications (active ingredients and biologic drugs) indicated for the treatment of AD (general and specific) were recorded based on the Anatomical Therapeutic Chemical Classification System.18 Information was obtained from the records of the dispensing pharmacy using the RCMPS application of CatSalut. The medication for a specific patient was chosen by the physician (daily clinical practice). The medications prescribed were obtained during the follow-up period (1 year). During the inclusion period, a series of biochemical and anthropometric parameters were also obtained (arterial blood pressure, body mass index, glucose, total cholesterol, and serum creatinine).
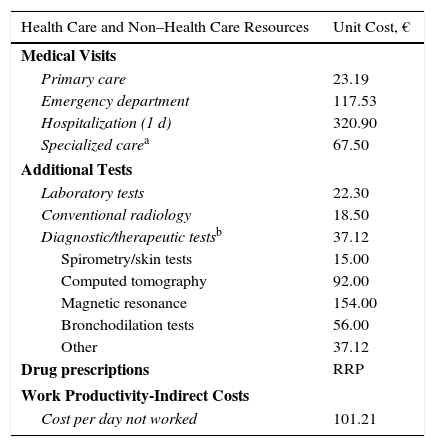
Usage of Resources and Associated CostsDirect health care costs (direct costs) were considered to be those associated with care provided by health professionals (medical visits, days of hospital stay, emergency department visits, diagnostic and therapeutic requests, medication); non–health care (indirect) costs were considered to be those associated with the loss of work productivity (days unable to work). The design of the cost system took into account the characteristics of the organizations and the stage of development of the available information systems. Cost was expressed as mean cost per patient-year (annual unit cost) obtained during follow-up (1 year from the index date). Table 3 shows the items analyzed and their associated costs (year 2015). The rates were obtained based on cost accounting at the individual study hospital, except for medication and sick leave. Prescriptions were quantified according to the retail price per container at the time of prescription. Days unable to work (loss of productivity) were quantified according to the minimum interprofessional salary (source, Spanish National Statistics Institute).19 This study did not take account of non–health care direct costs, namely, those considered “out of pocket” (ie, costs paid by the patients themselves or their families), as these are not recorded in the database and the study design prevented direct access to the patients.
Detail of Unit Costs and Work Productivity Lost (Year 2015).
| Health Care and Non–Health Care Resources | Unit Cost, € |
|---|---|
| Medical Visits | |
| Primary care | 23.19 |
| Emergency department | 117.53 |
| Hospitalization (1 d) | 320.90 |
| Specialized carea | 67.50 |
| Additional Tests | |
| Laboratory tests | 22.30 |
| Conventional radiology | 18.50 |
| Diagnostic/therapeutic testsb | 37.12 |
| Spirometry/skin tests | 15.00 |
| Computed tomography | 92.00 |
| Magnetic resonance | 154.00 |
| Bronchodilation tests | 56.00 |
| Other | 37.12 |
| Drug prescriptions | RRP |
| Work Productivity-Indirect Costs | |
| Cost per day not worked | 101.21 |
Abbreviation: RRP, recommended retail price.
The study was classified by the Spanish Agency for Medications and Medical Devices as EPA-OD (Estudio Post-Autorización, Otro Diseño [postauthorization study, other design]) and subsequently approved by the Ethics Committee of Universidad Internacional de Cataluña (UIC, Barcelona).
Statistical AnalysisData were validated to ensure the quality of the results. A descriptive univariate analysis of the variables of interest was performed. Qualitative data were expressed using absolute and relative frequencies. The percentages and 95% confidence intervals (CI) for the parameters of interest were based on the total number of patients with nonmissing values. Quantitative values were expressed using the mean (SD) and median (IQR). Normality was assessed using the Kolmogorov-Smirnov test. The bivariate analysis was performed using an analysis of variance test, χ2 test, and Pearson linear correlation coefficient. Multiple regression analysis was performed to obtain the variables associated with AD and the health care cost (stepwise). Costs were compared following the recommendations of Thompson and Barber20 using analysis of covariance, with sex, age, Charlson index, RUB, and time since diagnosis as covariates (estimated marginal means, Bonferroni correction). The analysis was performed using IBM SPSS Statistics for Windows, Version 19 (IBM Corp). Statistical significance was set at P<.05.
Sensitivity AnalysisGiven that the classification of AD as severe according to the criteria set out in the study could be underestimated (only patients receiving immunosuppressants or biologics and/or hospitalized patients were taken into account), a sensitivity analysis was performed. This included patients with severe AD receiving oral corticosteroids in order to determine health care costs and loss of work productivity (model corrected for covariates).
ResultsFrom an initial selection of 101 834 patients aged ≥18years in the study centers, 6287 were diagnosed with AD. After application of the exclusion criteria, a total of 6186 patients were finally included. Figure 1 shows the flow diagram of patients included in the study after taking into account the inclusion and exclusion criteria set out in Patients and Methods. We established 3 groups according to the severity of AD, as follows: mild, 55.7% (n=3445); moderate, 38.2% (n=2361); and severe, 6.1% (n=380).
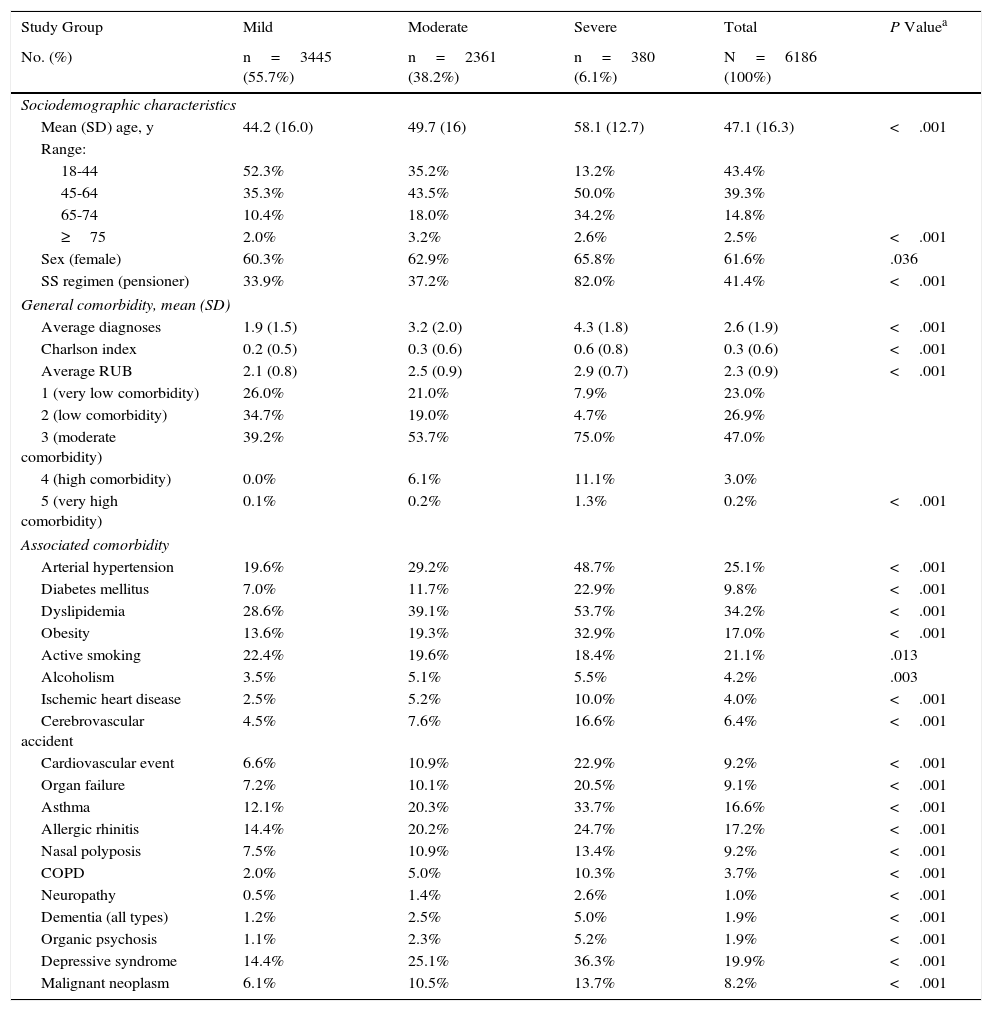
Table 4 shows the general characteristics of the study population according to the 3 groups. Mean age was 47.1years, and 61.6% were women. Morbidity associated with AD, measured using RUBs, was 2.3points. The main comorbid conditions in patients with AD were asthma, depressive syndrome, and dyslipidemia (33.7%, 36.3%, and 53.7%, respectively). Comorbidities are also shown in Table 4.
Baseline Characteristics of the Series by Study Group.
| Study Group | Mild | Moderate | Severe | Total | P Valuea |
|---|---|---|---|---|---|
| No. (%) | n=3445 (55.7%) | n=2361 (38.2%) | n=380 (6.1%) | N=6186 (100%) | |
| Sociodemographic characteristics | |||||
| Mean (SD) age, y | 44.2 (16.0) | 49.7 (16) | 58.1 (12.7) | 47.1 (16.3) | <.001 |
| Range: | |||||
| 18-44 | 52.3% | 35.2% | 13.2% | 43.4% | |
| 45-64 | 35.3% | 43.5% | 50.0% | 39.3% | |
| 65-74 | 10.4% | 18.0% | 34.2% | 14.8% | |
| ≥75 | 2.0% | 3.2% | 2.6% | 2.5% | <.001 |
| Sex (female) | 60.3% | 62.9% | 65.8% | 61.6% | .036 |
| SS regimen (pensioner) | 33.9% | 37.2% | 82.0% | 41.4% | <.001 |
| General comorbidity, mean (SD) | |||||
| Average diagnoses | 1.9 (1.5) | 3.2 (2.0) | 4.3 (1.8) | 2.6 (1.9) | <.001 |
| Charlson index | 0.2 (0.5) | 0.3 (0.6) | 0.6 (0.8) | 0.3 (0.6) | <.001 |
| Average RUB | 2.1 (0.8) | 2.5 (0.9) | 2.9 (0.7) | 2.3 (0.9) | <.001 |
| 1 (very low comorbidity) | 26.0% | 21.0% | 7.9% | 23.0% | |
| 2 (low comorbidity) | 34.7% | 19.0% | 4.7% | 26.9% | |
| 3 (moderate comorbidity) | 39.2% | 53.7% | 75.0% | 47.0% | |
| 4 (high comorbidity) | 0.0% | 6.1% | 11.1% | 3.0% | |
| 5 (very high comorbidity) | 0.1% | 0.2% | 1.3% | 0.2% | <.001 |
| Associated comorbidity | |||||
| Arterial hypertension | 19.6% | 29.2% | 48.7% | 25.1% | <.001 |
| Diabetes mellitus | 7.0% | 11.7% | 22.9% | 9.8% | <.001 |
| Dyslipidemia | 28.6% | 39.1% | 53.7% | 34.2% | <.001 |
| Obesity | 13.6% | 19.3% | 32.9% | 17.0% | <.001 |
| Active smoking | 22.4% | 19.6% | 18.4% | 21.1% | .013 |
| Alcoholism | 3.5% | 5.1% | 5.5% | 4.2% | .003 |
| Ischemic heart disease | 2.5% | 5.2% | 10.0% | 4.0% | <.001 |
| Cerebrovascular accident | 4.5% | 7.6% | 16.6% | 6.4% | <.001 |
| Cardiovascular event | 6.6% | 10.9% | 22.9% | 9.2% | <.001 |
| Organ failure | 7.2% | 10.1% | 20.5% | 9.1% | <.001 |
| Asthma | 12.1% | 20.3% | 33.7% | 16.6% | <.001 |
| Allergic rhinitis | 14.4% | 20.2% | 24.7% | 17.2% | <.001 |
| Nasal polyposis | 7.5% | 10.9% | 13.4% | 9.2% | <.001 |
| COPD | 2.0% | 5.0% | 10.3% | 3.7% | <.001 |
| Neuropathy | 0.5% | 1.4% | 2.6% | 1.0% | <.001 |
| Dementia (all types) | 1.2% | 2.5% | 5.0% | 1.9% | <.001 |
| Organic psychosis | 1.1% | 2.3% | 5.2% | 1.9% | <.001 |
| Depressive syndrome | 14.4% | 25.1% | 36.3% | 19.9% | <.001 |
| Malignant neoplasm | 6.1% | 10.5% | 13.7% | 8.2% | <.001 |
Abbreviations: COPD, chronic obstructive pulmonary disease; RUB, resource utilization bands; SS, social security.
The multivariate model showed that severe AD was associated with age (β=0.159), female sex (β=0.024), and general comorbidity (RUB, β=0.192), specifically asthma (β=0.138), depression (β=0.099), cardiovascular events (β=0.087), obesity (β=0.085), and smoking (β=0.025). The coefficient of determination of the model (R2) was 31.9%.
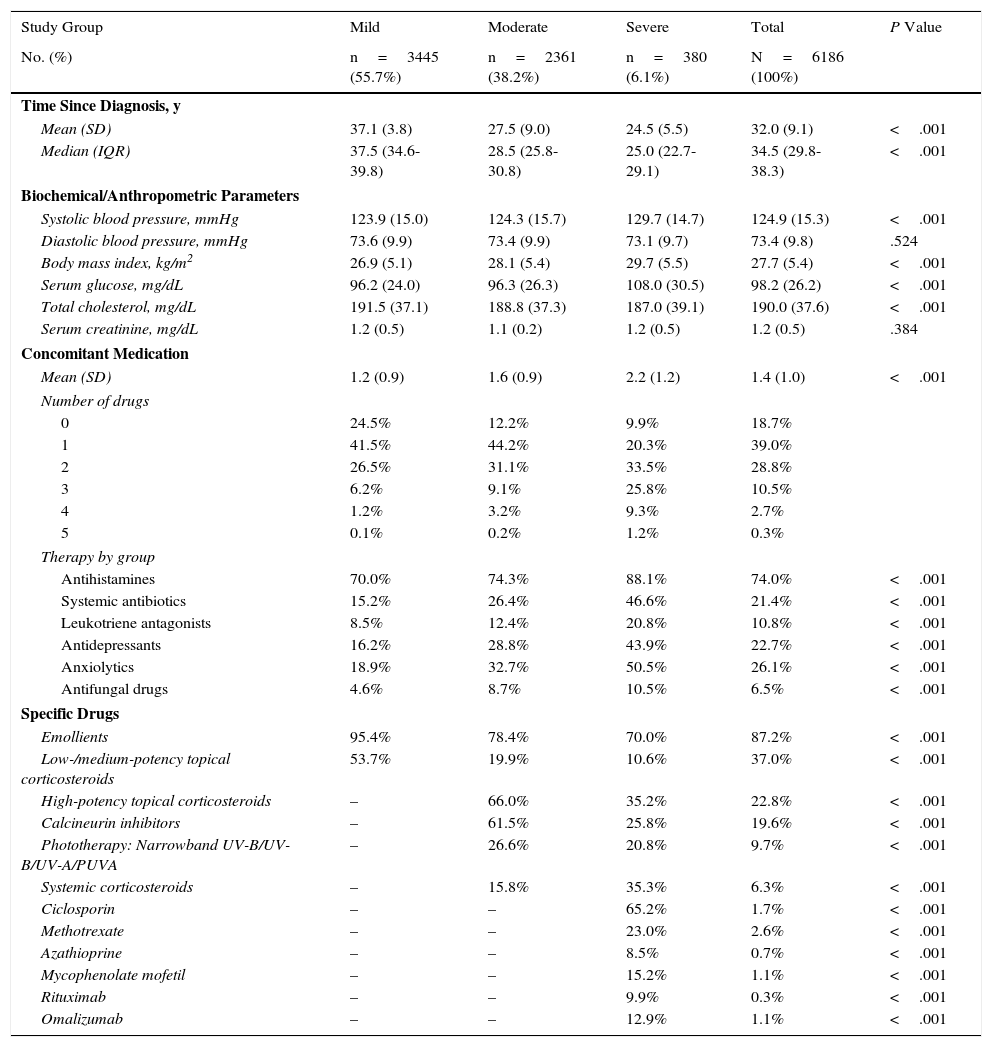
The distribution of clinical variables and concomitant and specific medication prescribed during the follow-up period is shown by study group in Table 5. The mean time from diagnosis was 32.0years, and mean (SD) concomitant medication was 1.4 (1.0) per patient-year: the most frequently administered drugs were antihistamines (74.0%), anxiolytics (26.1%), and antidepressants (22.7%). As for medication administered specifically for treatment of AD, the most frequent were emollients (87.2%), low- or medium-potency topical corticosteroids (37.0%), high-potency topical corticosteroids (22.8%), and calcineurin inhibitors (19.6%). Patients with severe AD received more concomitant medications than patients with moderate and mild AD (2.2 vs 1.6 and 1.2; P<.001): the main drugs were antihistamines (88.1% vs 74.3% and 70.0%; P<.001), anxiolytics (50.5% vs 32.7% and 18.9%; P<.001), and antidepressants (43.9% vs 28.8% and 16.2%; P<.001), respectively. The most frequently used drugs in patients with severe AD were methotrexate (23.0%) and ciclosporin (65.2%).
Distribution of Clinical Variables and Concomitant and Specific Medication Prescribed During Follow-up by Study Group.
| Study Group | Mild | Moderate | Severe | Total | P Value |
|---|---|---|---|---|---|
| No. (%) | n=3445 (55.7%) | n=2361 (38.2%) | n=380 (6.1%) | N=6186 (100%) | |
| Time Since Diagnosis, y | |||||
| Mean (SD) | 37.1 (3.8) | 27.5 (9.0) | 24.5 (5.5) | 32.0 (9.1) | <.001 |
| Median (IQR) | 37.5 (34.6-39.8) | 28.5 (25.8-30.8) | 25.0 (22.7-29.1) | 34.5 (29.8-38.3) | <.001 |
| Biochemical/Anthropometric Parameters | |||||
| Systolic blood pressure, mmHg | 123.9 (15.0) | 124.3 (15.7) | 129.7 (14.7) | 124.9 (15.3) | <.001 |
| Diastolic blood pressure, mmHg | 73.6 (9.9) | 73.4 (9.9) | 73.1 (9.7) | 73.4 (9.8) | .524 |
| Body mass index, kg/m2 | 26.9 (5.1) | 28.1 (5.4) | 29.7 (5.5) | 27.7 (5.4) | <.001 |
| Serum glucose, mg/dL | 96.2 (24.0) | 96.3 (26.3) | 108.0 (30.5) | 98.2 (26.2) | <.001 |
| Total cholesterol, mg/dL | 191.5 (37.1) | 188.8 (37.3) | 187.0 (39.1) | 190.0 (37.6) | <.001 |
| Serum creatinine, mg/dL | 1.2 (0.5) | 1.1 (0.2) | 1.2 (0.5) | 1.2 (0.5) | .384 |
| Concomitant Medication | |||||
| Mean (SD) | 1.2 (0.9) | 1.6 (0.9) | 2.2 (1.2) | 1.4 (1.0) | <.001 |
| Number of drugs | |||||
| 0 | 24.5% | 12.2% | 9.9% | 18.7% | |
| 1 | 41.5% | 44.2% | 20.3% | 39.0% | |
| 2 | 26.5% | 31.1% | 33.5% | 28.8% | |
| 3 | 6.2% | 9.1% | 25.8% | 10.5% | |
| 4 | 1.2% | 3.2% | 9.3% | 2.7% | |
| 5 | 0.1% | 0.2% | 1.2% | 0.3% | |
| Therapy by group | |||||
| Antihistamines | 70.0% | 74.3% | 88.1% | 74.0% | <.001 |
| Systemic antibiotics | 15.2% | 26.4% | 46.6% | 21.4% | <.001 |
| Leukotriene antagonists | 8.5% | 12.4% | 20.8% | 10.8% | <.001 |
| Antidepressants | 16.2% | 28.8% | 43.9% | 22.7% | <.001 |
| Anxiolytics | 18.9% | 32.7% | 50.5% | 26.1% | <.001 |
| Antifungal drugs | 4.6% | 8.7% | 10.5% | 6.5% | <.001 |
| Specific Drugs | |||||
| Emollients | 95.4% | 78.4% | 70.0% | 87.2% | <.001 |
| Low-/medium-potency topical corticosteroids | 53.7% | 19.9% | 10.6% | 37.0% | <.001 |
| High-potency topical corticosteroids | – | 66.0% | 35.2% | 22.8% | <.001 |
| Calcineurin inhibitors | – | 61.5% | 25.8% | 19.6% | <.001 |
| Phototherapy: Narrowband UV-B/UV-B/UV-A/PUVA | – | 26.6% | 20.8% | 9.7% | <.001 |
| Systemic corticosteroids | – | 15.8% | 35.3% | 6.3% | <.001 |
| Ciclosporin | – | – | 65.2% | 1.7% | <.001 |
| Methotrexate | – | – | 23.0% | 2.6% | <.001 |
| Azathioprine | – | – | 8.5% | 0.7% | <.001 |
| Mycophenolate mofetil | – | – | 15.2% | 1.1% | <.001 |
| Rituximab | – | – | 9.9% | 0.3% | <.001 |
| Omalizumab | – | – | 12.9% | 1.1% | <.001 |
Abbreviation: PUVA, psoralen-UV-A
aSignificant results were also significant in the pairwise comparison.
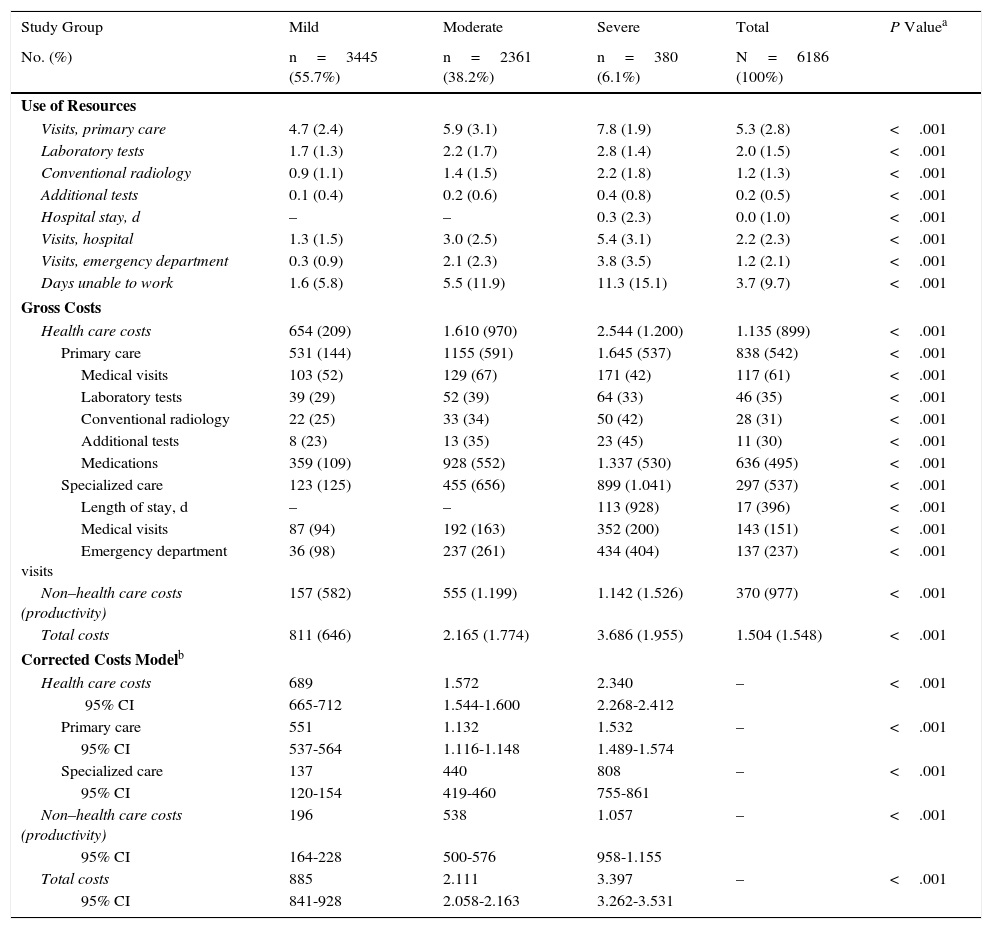
Table 6 shows the usage of resources and the associated costs (health care and non–health care) by study group. Patients with AD used more resources, especially for primary care visits (7.8 vs 5.9 and 4.7; P<.001), specialized care visits (5.4 vs 3.0 and 1.3; P<.001), and days unable to work (11.3 vs 5.5 and 1.6; P<.001). The average number of days of hospitalization was 0.30 per patient (n=18). The mean length of stay in patients who were admitted to hospital was 6.6days. No patients died during follow-up.
Use of Resources and Health Care and Non–Health Care Costs (Unit Average) by Study Groupa
| Study Group | Mild | Moderate | Severe | Total | P Valuea |
|---|---|---|---|---|---|
| No. (%) | n=3445 (55.7%) | n=2361 (38.2%) | n=380 (6.1%) | N=6186 (100%) | |
| Use of Resources | |||||
| Visits, primary care | 4.7 (2.4) | 5.9 (3.1) | 7.8 (1.9) | 5.3 (2.8) | <.001 |
| Laboratory tests | 1.7 (1.3) | 2.2 (1.7) | 2.8 (1.4) | 2.0 (1.5) | <.001 |
| Conventional radiology | 0.9 (1.1) | 1.4 (1.5) | 2.2 (1.8) | 1.2 (1.3) | <.001 |
| Additional tests | 0.1 (0.4) | 0.2 (0.6) | 0.4 (0.8) | 0.2 (0.5) | <.001 |
| Hospital stay, d | – | – | 0.3 (2.3) | 0.0 (1.0) | <.001 |
| Visits, hospital | 1.3 (1.5) | 3.0 (2.5) | 5.4 (3.1) | 2.2 (2.3) | <.001 |
| Visits, emergency department | 0.3 (0.9) | 2.1 (2.3) | 3.8 (3.5) | 1.2 (2.1) | <.001 |
| Days unable to work | 1.6 (5.8) | 5.5 (11.9) | 11.3 (15.1) | 3.7 (9.7) | <.001 |
| Gross Costs | |||||
| Health care costs | 654 (209) | 1.610 (970) | 2.544 (1.200) | 1.135 (899) | <.001 |
| Primary care | 531 (144) | 1155 (591) | 1.645 (537) | 838 (542) | <.001 |
| Medical visits | 103 (52) | 129 (67) | 171 (42) | 117 (61) | <.001 |
| Laboratory tests | 39 (29) | 52 (39) | 64 (33) | 46 (35) | <.001 |
| Conventional radiology | 22 (25) | 33 (34) | 50 (42) | 28 (31) | <.001 |
| Additional tests | 8 (23) | 13 (35) | 23 (45) | 11 (30) | <.001 |
| Medications | 359 (109) | 928 (552) | 1.337 (530) | 636 (495) | <.001 |
| Specialized care | 123 (125) | 455 (656) | 899 (1.041) | 297 (537) | <.001 |
| Length of stay, d | – | – | 113 (928) | 17 (396) | <.001 |
| Medical visits | 87 (94) | 192 (163) | 352 (200) | 143 (151) | <.001 |
| Emergency department visits | 36 (98) | 237 (261) | 434 (404) | 137 (237) | <.001 |
| Non–health care costs (productivity) | 157 (582) | 555 (1.199) | 1.142 (1.526) | 370 (977) | <.001 |
| Total costs | 811 (646) | 2.165 (1.774) | 3.686 (1.955) | 1.504 (1.548) | <.001 |
| Corrected Costs Modelb | |||||
| Health care costs | 689 | 1.572 | 2.340 | – | <.001 |
| 95% CI | 665-712 | 1.544-1.600 | 2.268-2.412 | ||
| Primary care | 551 | 1.132 | 1.532 | – | <.001 |
| 95% CI | 537-564 | 1.116-1.148 | 1.489-1.574 | ||
| Specialized care | 137 | 440 | 808 | – | <.001 |
| 95% CI | 120-154 | 419-460 | 755-861 | ||
| Non–health care costs (productivity) | 196 | 538 | 1.057 | – | <.001 |
| 95% CI | 164-228 | 500-576 | 958-1.155 | ||
| Total costs | 885 | 2.111 | 3.397 | – | <.001 |
| 95% CI | 841-928 | 2.058-2.163 | 3.262-3.531 | ||
Abbreviation: CI, confidence interval.
The total cost of patients included in the study reached €9.3 million, of which 75.5% were health care costs and 24.5% non–health care costs (loss of productivity). Of the total health care costs, 55.7% were generated in primary care and 19.7% in specialized care. Concomitant/specific medication generated the highest share of total costs (42.3%), followed by visits for specialized care (9.5%) (Table 6). The average unit cost as a component of the total cost was €1504/year. The average unit health care costs were higher for patients with severe AD than for patients with moderate and mild AD (€3686 vs €2165 and €811, respectively, P<.001). All components of health care costs were higher for patients with severe AD. The average unit cost as a component of the total cost corrected for covariates (analysis of covariance) was greater in patients with severe AD than in patients with moderate and mild AD (€3397 vs €2111 and €885, respectively, P<.001). These differences were maintained for health care costs (€2340 vs €1572 and €689; P<.001) and non–health care costs (loss of work productivity: €1057 vs €538 and €196, P<.001), respectively.
In the binary correlation model, health care cost was highly correlated with severity of AD (r=0.715), comorbidity (RUB; r=0.455), number of drugs prescribed (r=0.400), and age (r=0.297) (P<.001).
In the multiple linear regression model (stepwise), cost was associated with severity of AD (β=0.398), comorbidity (RUB; β=0.239), asthma (β=0.231), and number of drugs administered (β=0.187) (P<0.01 in all cases). Figure 2 shows the main components of the total cost by study group and disease burden. The proportion of cost in specialized care compared with total cost is greater in moderate to severe AD. The greater health care cost of patients with high comorbidity is noteworthy (€4545 [linear trend]).
Distribution of the main components of the total cost by study group and disease burden.
Results were statistically significant (P<.05) in all pairwise comparisons.
RUB indicates resource utilization bands; R,2 coefficient of determination (linear model).
Figure 3 shows the comparison between health care costs and losses of productivity according to the classification of severity, which was based on the treatment administered (corrected average/unit) (sensitivity analysis). No clinically relevant differences were observed according to the 2 classifications of severe AD analyzed.
Sensitivity analysis. Comparison between health care costs and loss of productivity according to the classification of severity by treatment administered (average/unit). STU indicates results of study performed. Patients with severe atopic dermatitis were those receiving immunosuppressants or biologics, and/or hospitalized patients (groups: mild, n=3445; moderate, n=2361; and severe, n=380). SEN, sensitivity analysis, which included patients receiving oral corticosteroids in the severe atopic dermatitis group (groups: mild, n=3445; moderate, n=2075; and severe, n=666).
AD generates considerable consumption of resources and a marked cost burden for health systems and patients and their families, especially in the case of severe AD.21 The present study showed that the average cost of adult AD was €1504, with notable differences between severe forms, whose cost (€3686) was more than 4-fold higher than that of mild forms (€811). Furthermore, severe AD was associated with age, female sex, and the presence of greater general comorbidity (asthma, depression, cardiovascular events, obesity, and smoking). The weight of these factors in the prognosis of AD has been assessed elsewhere, thus highlighting the coherence of our results.22,23 Expenditure was mostly accounted for by health care costs (75.5%), with the remainder (24.5%) arising from loss of productivity. In the case of the former, most of the cost was generated by drug prescription, followed by specialist care. However, it is important to remember that out-of-pocket expenses for patients and their families—both direct and indirect—were not included. These expenses may be associated with supplementary over-the-counter therapy or with unidentifiable visit-related costs such as days unable to work. Comparisons with similar studies are complex owing to differences in the health care settings and study design. In a study performed in Korea, Kim et al.11 reported an annual direct cost of €2102, of which the part attributable to health care costs and to loss of productivity was similar to that reported in the present study. Fowler et al.24 performed a retrospective study (n=41 247) in which they reported an average cost burden of US$991 per patient-year, highlighting that 38% was attributable to days unable to work. Suh et al.25 reported how costs associated with drugs for AD increased in cases associated with asthma—as in the present study—from US$482 to US$973 when AD was associated with asthma and/or rhinitis. Whiteley et al.26 reported that 30% of costs resulted from annual lost productivity and its impact on quality of life. Finally, in a recent review, Drucke et al.27 report the marked social, economic, and occupational impact of AD, as well as its effect on quality of life. The authors calculated the annual cost of AD from a conservative perspective and found it to be €5297millon in a population of approximately 322 million persons in 2016.
The present study shows that, in addition to the severity of AD, comorbidity and bronchial asthma are associated with greater costs and use of health care resources for the Spanish National Health System. In fact, the health care cost of patients with high comorbidity alone was €4545. This observation enables us to suggest that the AD is more than simply a cutaneous condition and that optimization of both costs and outcomes could benefit from a multidisciplinary approach.
According to the study parameters, the severity of AD was classed as mild in 55.7% of cases (n=3445), moderate in 38.2% (n=2361), and severe in 6.1% (n=380). As this was a population-based study, in which both clinical reporting by physicians and setting varied (primary and specialized care), we chose treatment administered as a parameter for classifying disease severity. Although scales for grading AD (eg, Scoring Atopic Dermatitis [SCORAD], Eczema Area and Severity Index [EASI], and Six Area, Six Sign Atopic Dermatitis Severity Index [SASSAD]) are available, their use is restricted to clinical trials, and they do not form part of daily clinical practice. Several algorithms propose scaling therapy according to severity; therefore, identification of the drugs prescribed, which were in fact recorded reliably, are a marker of the resources used by the physician to manage skin disease.15,28 However, given that systemic immunosuppressants are often restricted to specialized settings, we cannot rule out the possibility that this approach led to an underestimation of severe cases.
While one might think that variations in the course of AD could affect the classification criteria applied during the inclusion period, the estimated frequency of flare-ups, especially in moderate and severe forms, make it unlikely. In Spain, the results of the ACTIDA study,29 which was based on data from 227 dermatologists (N=1441), showed a mean of 3.6flare-ups/year. Most patients (97.2%) stated that they always or occasionally requested a medical evaluation.
Our results show marked heterogeneity in the treatment of AD, especially in the severe form. In addition to treatment for the disease itself, it is worth noting the increased use of concomitant medication such as antihistamines, anxiolytics, and antidepressants, although it is not possible to determine to what extent their prescription is associated with AD. Nevertheless, the association between anxiety, depression, and AD is well recognized.22
The most commonly used drugs prescribed for treatment of AD were systemic corticosteroids, methotrexate, and ciclosporin. CiclosporinA is the only drug approved for the treatment of AD and the drug of choice in various guidelines and recommendations.23 Methotrexate, azathioprine, and mycophenolate mofetil are considered second-line drugs, with a moderate probability of response and a safety profile that often leads treatment to be suspended. Since no specific treatment has priority, choice may be based on prescribing habits at the reference specialist centers in the study.30
Systemic corticosteroid regimens, on the other hand, were in fact a common therapeutic resource. While systemic corticosteroids are not generally considered a first-line regimen—their use is advised against owing to the lack of scientific evidence and poor safety profile—they are commonly used to control exacerbations.31
Given that therapeutic algorithms are heterogeneous in terms of the value of systemic corticosteroids as a marker of moderate or severe forms of AD, we performed a sensitivity analysis in which both possibilities were considered. The results show that the decision on whether or not to prescribe these drugs—which may depend on prescribing habits at specific centers or among specific professionals—has little impact on the final classification (Figure 3).
The present study is subject to a series of limitations. Those associated with the classification of the disease as mild, moderate, and severe have been addressed above. However, weighting severity by treatment clearly reflects the impact of management on costs. Operative measurement of costs is associated with the geographical setting, which may limit extrapolation of our findings to health care systems with a different structure. As this is an observational study, its retrospective nature could favor underrecording of disease or potential variability resulting from differences between professionals and between patients. In this sense, potentially inaccurate coding in the diagnosis of moderate to severe and other comorbidities, or even the absence of variables that could affect the final results (eg, patients’ socioeconomic level, work, drug dose over time, adherence, causes of AD, phenotypes), should be considered a study limitation. However, we must draw attention to the high number of persons included over a limited time period that was well defined in all cases; such a circumstance would hardly be possible in a multicenter retrospective or prospective study carried out in the same setting based on collection of data by clinicians. Similarly, no data were provided on overlaps in medication between flare-ups and maintenance owing to the difficulty in measuring them. In addition, the external validity of the results (representativeness in the regional and national population), the evaluation of indirect costs (only for losses in work productivity), and the difference between moderate and severe AD should be considered possible study limitations.
Treatment of AD is expensive in terms of consumption of resources and social costs. However, the present study was not designed to collect health care outcomes associated with this cost. Several studies conclude that, despite the availability of treatment, some needs are not covered, especially in patients with more severe forms of AD.3,15 Therefore, while somewhat speculative, it seems feasible that resources were consumed inefficiently. Such a circumstance must be thoroughly addressed in the subgroup of patients with severe forms and greater consumption of resources. The arrival of new biologics, which are currently in advanced stages of development, makes it possible to improve the potential response in severe forms of the disease.21
The improvements brought about by these drugs, however, may be associated with an increase in the direct costs of the disease (drug costs), as has been observed in the case of psoriasis or other chronic inflammatory diseases, which should be weighted for improvements in global health care costs (number of visits, admissions to hospital, additional examinations) and social costs.32 It is therefore essential to know the baseline impact of the disease before such a paradigm shift is possible.
The present study reveals the notable impact of AD on health care and social costs, which is more marked in severe forms and in those that manifest alongside other conditions. Future studies should examine health outcomes arising from disease burden and assess uncovered needs in this chronic skin condition.
FundingThe study was sponsored by Sanofi.
Conflicts of InterestA. Sicras is an independent consultant who received funding by Sanofi for work on this manuscript. José-Manuel Carrascosa has been a researcher in clinical trials promoted by Sanofi.
Please cite this article as: Sicras-Mainar A, Navarro-Artieda R, Carrascosa Carrillo JM. Impacto económico de la dermatitis atópica en adultos: estudio de base poblacional (estudio IDEA). Actas Dermosifiliogr. 2018;109:35–46.
