Since the introduction of biological drugs, a 75% reduction in the psoriasis area and severity index score (PASI 75) relative to baseline values has been the primary measure used in most clinical trials.1–4 With the emergence of new, high-efficacy interleukin-17 inhibitors,3,4 the use of PASI 90 and PASI 100 has become more frequent. However, in routine clinical practice absolute PASI is much more commonly used to quantify treatment effectiveness.
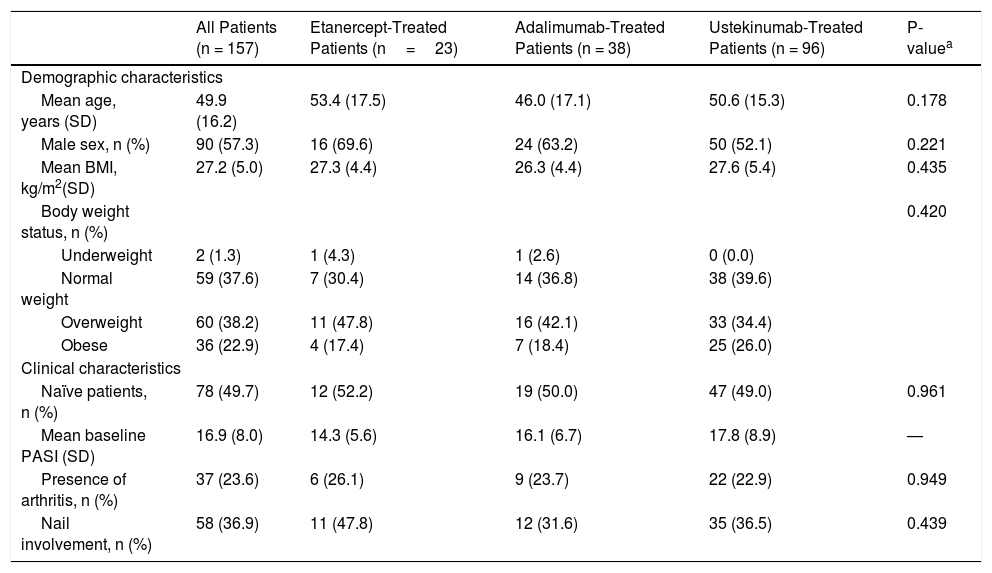
The main objective of this study was to compare absolute PASI score with the relative reduction in PASI in patients treated with etanercept (ETN), adalimumab (ADA), and ustekinumab (UST). In addition, we evaluated the long-term clinical effectiveness of each biological treatment. This was an observational, retrospective, single-center study of adult patients with moderate-to-severe plaque psoriasis who were treated with biological drugs for at least 1 year between June 2005 and May 2017. Although no exclusion criteria were specified when designing the study, patients treated with infliximab were excluded owing to the small sample size (n = 4). Demographic characteristics and clinical data were recorded at the beginning of the last biological treatment (Table 1Table 2). Where relevant, reasons for treatment discontinuation were also recorded.
Demographic and Clinical Characteristics of the Study Population
| All Patients (n = 157) | Etanercept-Treated Patients (n=23) | Adalimumab-Treated Patients (n = 38) | Ustekinumab-Treated Patients (n = 96) | P-valuea | |
|---|---|---|---|---|---|
| Demographic characteristics | |||||
| Mean age, years (SD) | 49.9 (16.2) | 53.4 (17.5) | 46.0 (17.1) | 50.6 (15.3) | 0.178 |
| Male sex, n (%) | 90 (57.3) | 16 (69.6) | 24 (63.2) | 50 (52.1) | 0.221 |
| Mean BMI, kg/m2(SD) | 27.2 (5.0) | 27.3 (4.4) | 26.3 (4.4) | 27.6 (5.4) | 0.435 |
| Body weight status, n (%) | 0.420 | ||||
| Underweight | 2 (1.3) | 1 (4.3) | 1 (2.6) | 0 (0.0) | |
| Normal weight | 59 (37.6) | 7 (30.4) | 14 (36.8) | 38 (39.6) | |
| Overweight | 60 (38.2) | 11 (47.8) | 16 (42.1) | 33 (34.4) | |
| Obese | 36 (22.9) | 4 (17.4) | 7 (18.4) | 25 (26.0) | |
| Clinical characteristics | |||||
| Naïve patients, n (%) | 78 (49.7) | 12 (52.2) | 19 (50.0) | 47 (49.0) | 0.961 |
| Mean baseline PASI (SD) | 16.9 (8.0) | 14.3 (5.6) | 16.1 (6.7) | 17.8 (8.9) | — |
| Presence of arthritis, n (%) | 37 (23.6) | 6 (26.1) | 9 (23.7) | 22 (22.9) | 0.949 |
| Nail involvement, n (%) | 58 (36.9) | 11 (47.8) | 12 (31.6) | 35 (36.5) | 0.439 |
Abbreviations: BMI, body mass index; PASI, psoriasis area severity index; SD, standard deviation.
Underweight, <18.5 kg/m2; Normal weight, 18.5–24.9 kg/m2; Overweight, 25–29.9 kg/m2; Obese, ≥30kg/m2.
a Comparison of the 3 treatment groups: single-factor analysis of variance for continuous variables and χ2 test for nominal variables.
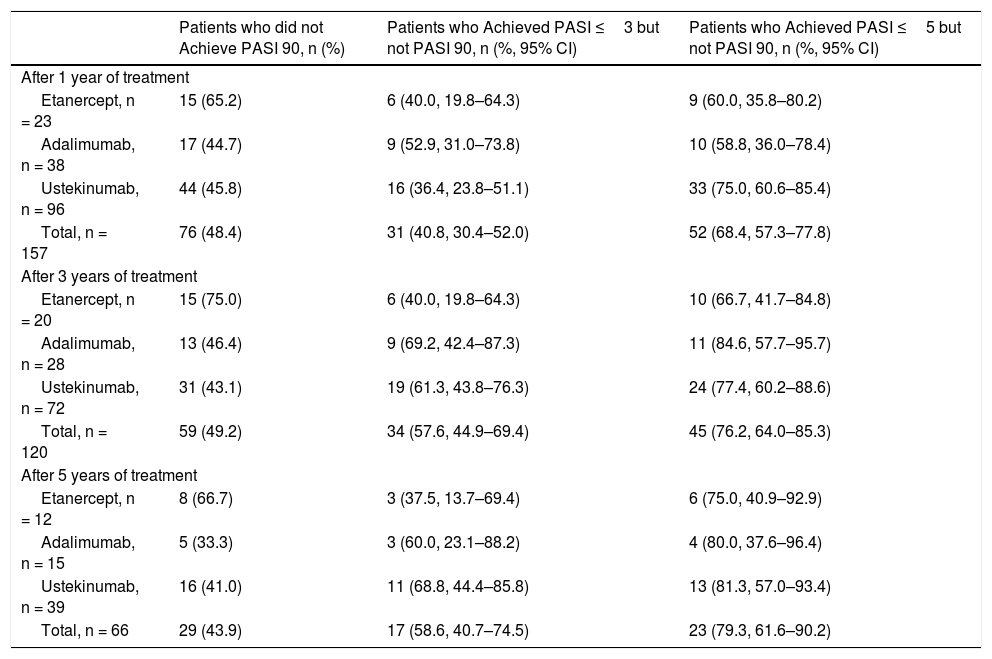
Patients who Achieved PASI ≤3 and/or PASI ≤5 but not PASI 90
| Patients who did not Achieve PASI 90, n (%) | Patients who Achieved PASI ≤3 but not PASI 90, n (%, 95% CI) | Patients who Achieved PASI ≤5 but not PASI 90, n (%, 95% CI) | |
|---|---|---|---|
| After 1 year of treatment | |||
| Etanercept, n = 23 | 15 (65.2) | 6 (40.0, 19.8–64.3) | 9 (60.0, 35.8–80.2) |
| Adalimumab, n = 38 | 17 (44.7) | 9 (52.9, 31.0–73.8) | 10 (58.8, 36.0–78.4) |
| Ustekinumab, n = 96 | 44 (45.8) | 16 (36.4, 23.8–51.1) | 33 (75.0, 60.6–85.4) |
| Total, n = 157 | 76 (48.4) | 31 (40.8, 30.4–52.0) | 52 (68.4, 57.3–77.8) |
| After 3 years of treatment | |||
| Etanercept, n = 20 | 15 (75.0) | 6 (40.0, 19.8–64.3) | 10 (66.7, 41.7–84.8) |
| Adalimumab, n = 28 | 13 (46.4) | 9 (69.2, 42.4–87.3) | 11 (84.6, 57.7–95.7) |
| Ustekinumab, n = 72 | 31 (43.1) | 19 (61.3, 43.8–76.3) | 24 (77.4, 60.2–88.6) |
| Total, n = 120 | 59 (49.2) | 34 (57.6, 44.9–69.4) | 45 (76.2, 64.0–85.3) |
| After 5 years of treatment | |||
| Etanercept, n = 12 | 8 (66.7) | 3 (37.5, 13.7–69.4) | 6 (75.0, 40.9–92.9) |
| Adalimumab, n = 15 | 5 (33.3) | 3 (60.0, 23.1–88.2) | 4 (80.0, 37.6–96.4) |
| Ustekinumab, n = 39 | 16 (41.0) | 11 (68.8, 44.4–85.8) | 13 (81.3, 57.0–93.4) |
| Total, n = 66 | 29 (43.9) | 17 (58.6, 40.7–74.5) | 23 (79.3, 61.6–90.2) |
Abbreviation: 95% CI, 95% confidence interval; PASI, psoriasis area and severity index score.
Statistical analyses were performed with the SPSS® statistical package version 21 for Windows (SPSS Inc, Chicago, Illinois, USA) and statistical significance set at 0.05. A data-as-observed approach was applied (i.e., no substitution methods were applied in cases of missing data).
The study population consisted of 157 patients, of whom 23 (14.6%) were treated with ETN, 38 (24.2%) with ADA, and 96 (61.1%) with UST. Table 1 shows the baseline characteristics of the study population. There were no significant differences in PASI variables between groups at baseline.
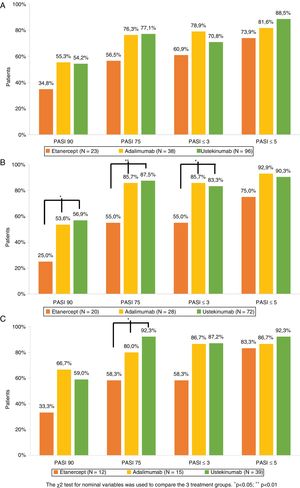
The percentage of patients who achieved PASI 75, PASI 90, PASI ≤5, and PASI ≤3 after 1, 3, and 5 years of treatment is shown in Figure 1. Analysis of the combined study population and of each treatment group revealed that for the 3 timepoints studied a non-negligible percentage of patients who did not achieve PASI 90 did achieve PASI ≤5 or PASI ≤3 (Table 3). Of the patients who did not achieve PASI 90 after 1 year of treatment, 68.4% achieved PASI ≤5 and 40.8% achieved PASI ≤3. The corresponding comparisons after 3 and 5 years revealed even higher rates, although sample sizes for these timepoints were smaller (Table 3).
Psoriasis area and severity index (PASI) score: absolute (PASI ≤3 and PASI ≤5) and relative (PASI 90 and PASI 75) scores after 1 (A), 3 (B), and 5 (C) years of biological drug treatment (Table 2).
The 3 treatment groups were compared using the χ2 test for nominal variables (*p<0.05, **p<0.01).
Patient Distribution Over Time
| Treatment Group | Patients Treated for >1 and <3 Years (%) | Patients Treated for >3 and <5 Years (%) | Treatment Discontinuation | Secondary Therapeutic Failure | Adverse Event | Loss to Follow-Up | Therapeutic Successa |
|---|---|---|---|---|---|---|---|
| Etanercept, n = 23 (%) | 2 (8.7) | 0 (0) | 9 (39.1) | 8 (34.7) | 0 (0) | 1 (4.3) | 0 (0) |
| Adalimumab, n = 38 (%) | 4 (10.5) | 9 (23.7) | 10 (26.3) | 6 (15.8) | 2 (5.3) | 2 (5.3) | 0 (0) |
| Ustekinumab, n = 96 (%) | 14 (14.6) | 16 (16.6) | 27 (28.1) | 12 (12.5) | 1 (1.0) | 12b (12.5) | 2 (2.1) |
| Total, n = 157 (%) | 20 (12.7) | 25 (15.9) | 46 (29.2) | 26 (16.5) | 3 (1.9) | 15 (9.5) | 2 (1.3) |
Comparable efficacy was not observed across groups at each of the timepoints analyzed (Fig. 1). After 1 year of treatment no significant differences in PASI variables were observed between the 3 treatment groups. After 3 years of treatment the percentage of patients who achieved PASI 90, PASI 75, and PASI ≤3 was higher in UST- than ETN-treated patients (p = 0.011, p = 0.001, and p = 0.08, respectively) and ADA- than ETN- treated patients (p = 0.048, p = 0.018, and p = 0.018, respectively). After 5 years of treatment, the only significant difference observed was in the proportion of patients who achieved PASI 75 in UST- versus ETN-treated patients (p = 0.005).
The main reason for discontinuation was secondary therapeutic failure (16.5%) followed by loss to follow-up (9.5%). Adverse events that required suspension of treatment were reported by 3 patients: 2 in the ADA-treated group (alopecia areata and arterial hypertension) and 1 in the UST-treated group (tachycardia and headache).
Absolute PASI is the endpoint most commonly used to evaluate therapeutic success in routine clinical practice. There is a growing consensus that absolute PASI scores of ≤3 and ≤5 may constitute better measures of therapeutic success.5 The consensus document on the evaluation and treatment of moderate-to-severe psoriasis recently published by the Spanish Academy of Dermatology and Venereology considers a PASI score <5 to be indicative of an appropriate treatment response.6 However, a European consensus document defining treatment goals for moderate-to-severe psoriasis does not consider absolute PASI as a valid endpoint for the measurement of therapeutic success.7 Furthermore, studies comparing absolute and relative PASI scores are scarce. In their prospective, multicenter BioCAPTURE study Zweegers and coworkers found that after 24 weeks of treatment PASI ≤5 was achieved by a considerable proportion of patients who failed to achieve either PASI 90 or PASI 100 (51.9 and 57.6%, respectively).8
In our series we observed better outcomes in patients treated with UST and ADA than those treated with ETN. These differences were significant at 3 and 5 years. A study of patients with moderate-to-severe psoriasis who were treated with ADA for 3 years found that PASI 75 and PASI 90 were achieved by 76% and 50% of patients, respectively.9 In another study of patients with moderate-to-severe psoriasis treated with UST for 5 years, PASI 75 and PASI 90 were achieved by 63% and 40% of patients, respectively.10 The higher rates observed in our study population may be due to the fact that we did not employ any data substitution method (data-as-observed). By contrast, the authors of the aforementioned studies applied a last-observation-carried-forward approach.10
Limitations of the present study include its retrospective, single-center nature and the variability in sample size across the 3 treatment groups. A key strength of the study is its evaluation of treatment effectiveness over a period of 5 years in routine clinical practice conditions.
In conclusion, we show that in each of the 3 treatment groups a non-negligible percentage of patients who failed to achieve PASI 90 did achieve PASI ≤5 and PASI ≤3. These findings suggest that in clinical practice absolute PASI score may be a better measure of therapeutic success than the relative reduction in PASI score.
Conflicts of InterestThe authors have provided consulting services to, received conference fees or funding to attend training activities from, and/or participated in clinical trials conducted by Janssen, Abbvie, and Novartis (Elena del Alcázar Viladomiu); and Janssen, Abbvie, Novartis, and Pfizer (Nuria Lamas Doménech and Montserrat Salons Redonnet).
Please cite this article as: del Alcázar Viladomiu E, Lamas Doménech N, Salleras Redonnet M. PASI absoluto versus PASI relativo en la práctica clínica real. Actas Dermosifiliogr. 2019;110:606–610.


